On the 1D BTC/USD chart, we can see that the leading crypto-asset remains range-bound between the daily ,600 and ,000 levels.Rumors earlier in the week regarding PayPal possibly adding support for Bitcoin and other cryptocurrencies on its platform, sparked a small rally but failed to fuel a much-needed breakout above a key resistance level at ,780.The pump was subsequently followed by a sharp sell-off below the previous weekly open at ,300 (white line on the following chart), which will now likely act as a difficult ceiling for bullish traders to break going into the rest of this week.This will be a vital level to watch in the short-term and should provide a good indication of how confident buyers are in the market right now.BTC/USDT Binance Daily ChartBTC/USDT Binance 4-Hour
Topics:
Yuval Gov considers the following as important: Bitcoin (BTC) Price, BTC Analysis, btcusd, btcusdt
This could be interesting, too:
Chayanika Deka writes XRP, SOL, and ADA Inclusion in US Crypto Reserve Pushes Traders on Edge
Chayanika Deka writes Why Arthur Hayes Is Bullish on Bitcoin Under Trump’s Economic Strategy
Mandy Williams writes Why the Bitcoin Market Is Stuck—and the Key Metric That Could Change It: CryptoQuant CEO
Wayne Jones writes Metaplanet Acquires 156 BTC, Bringing Total Holdings to 2,391
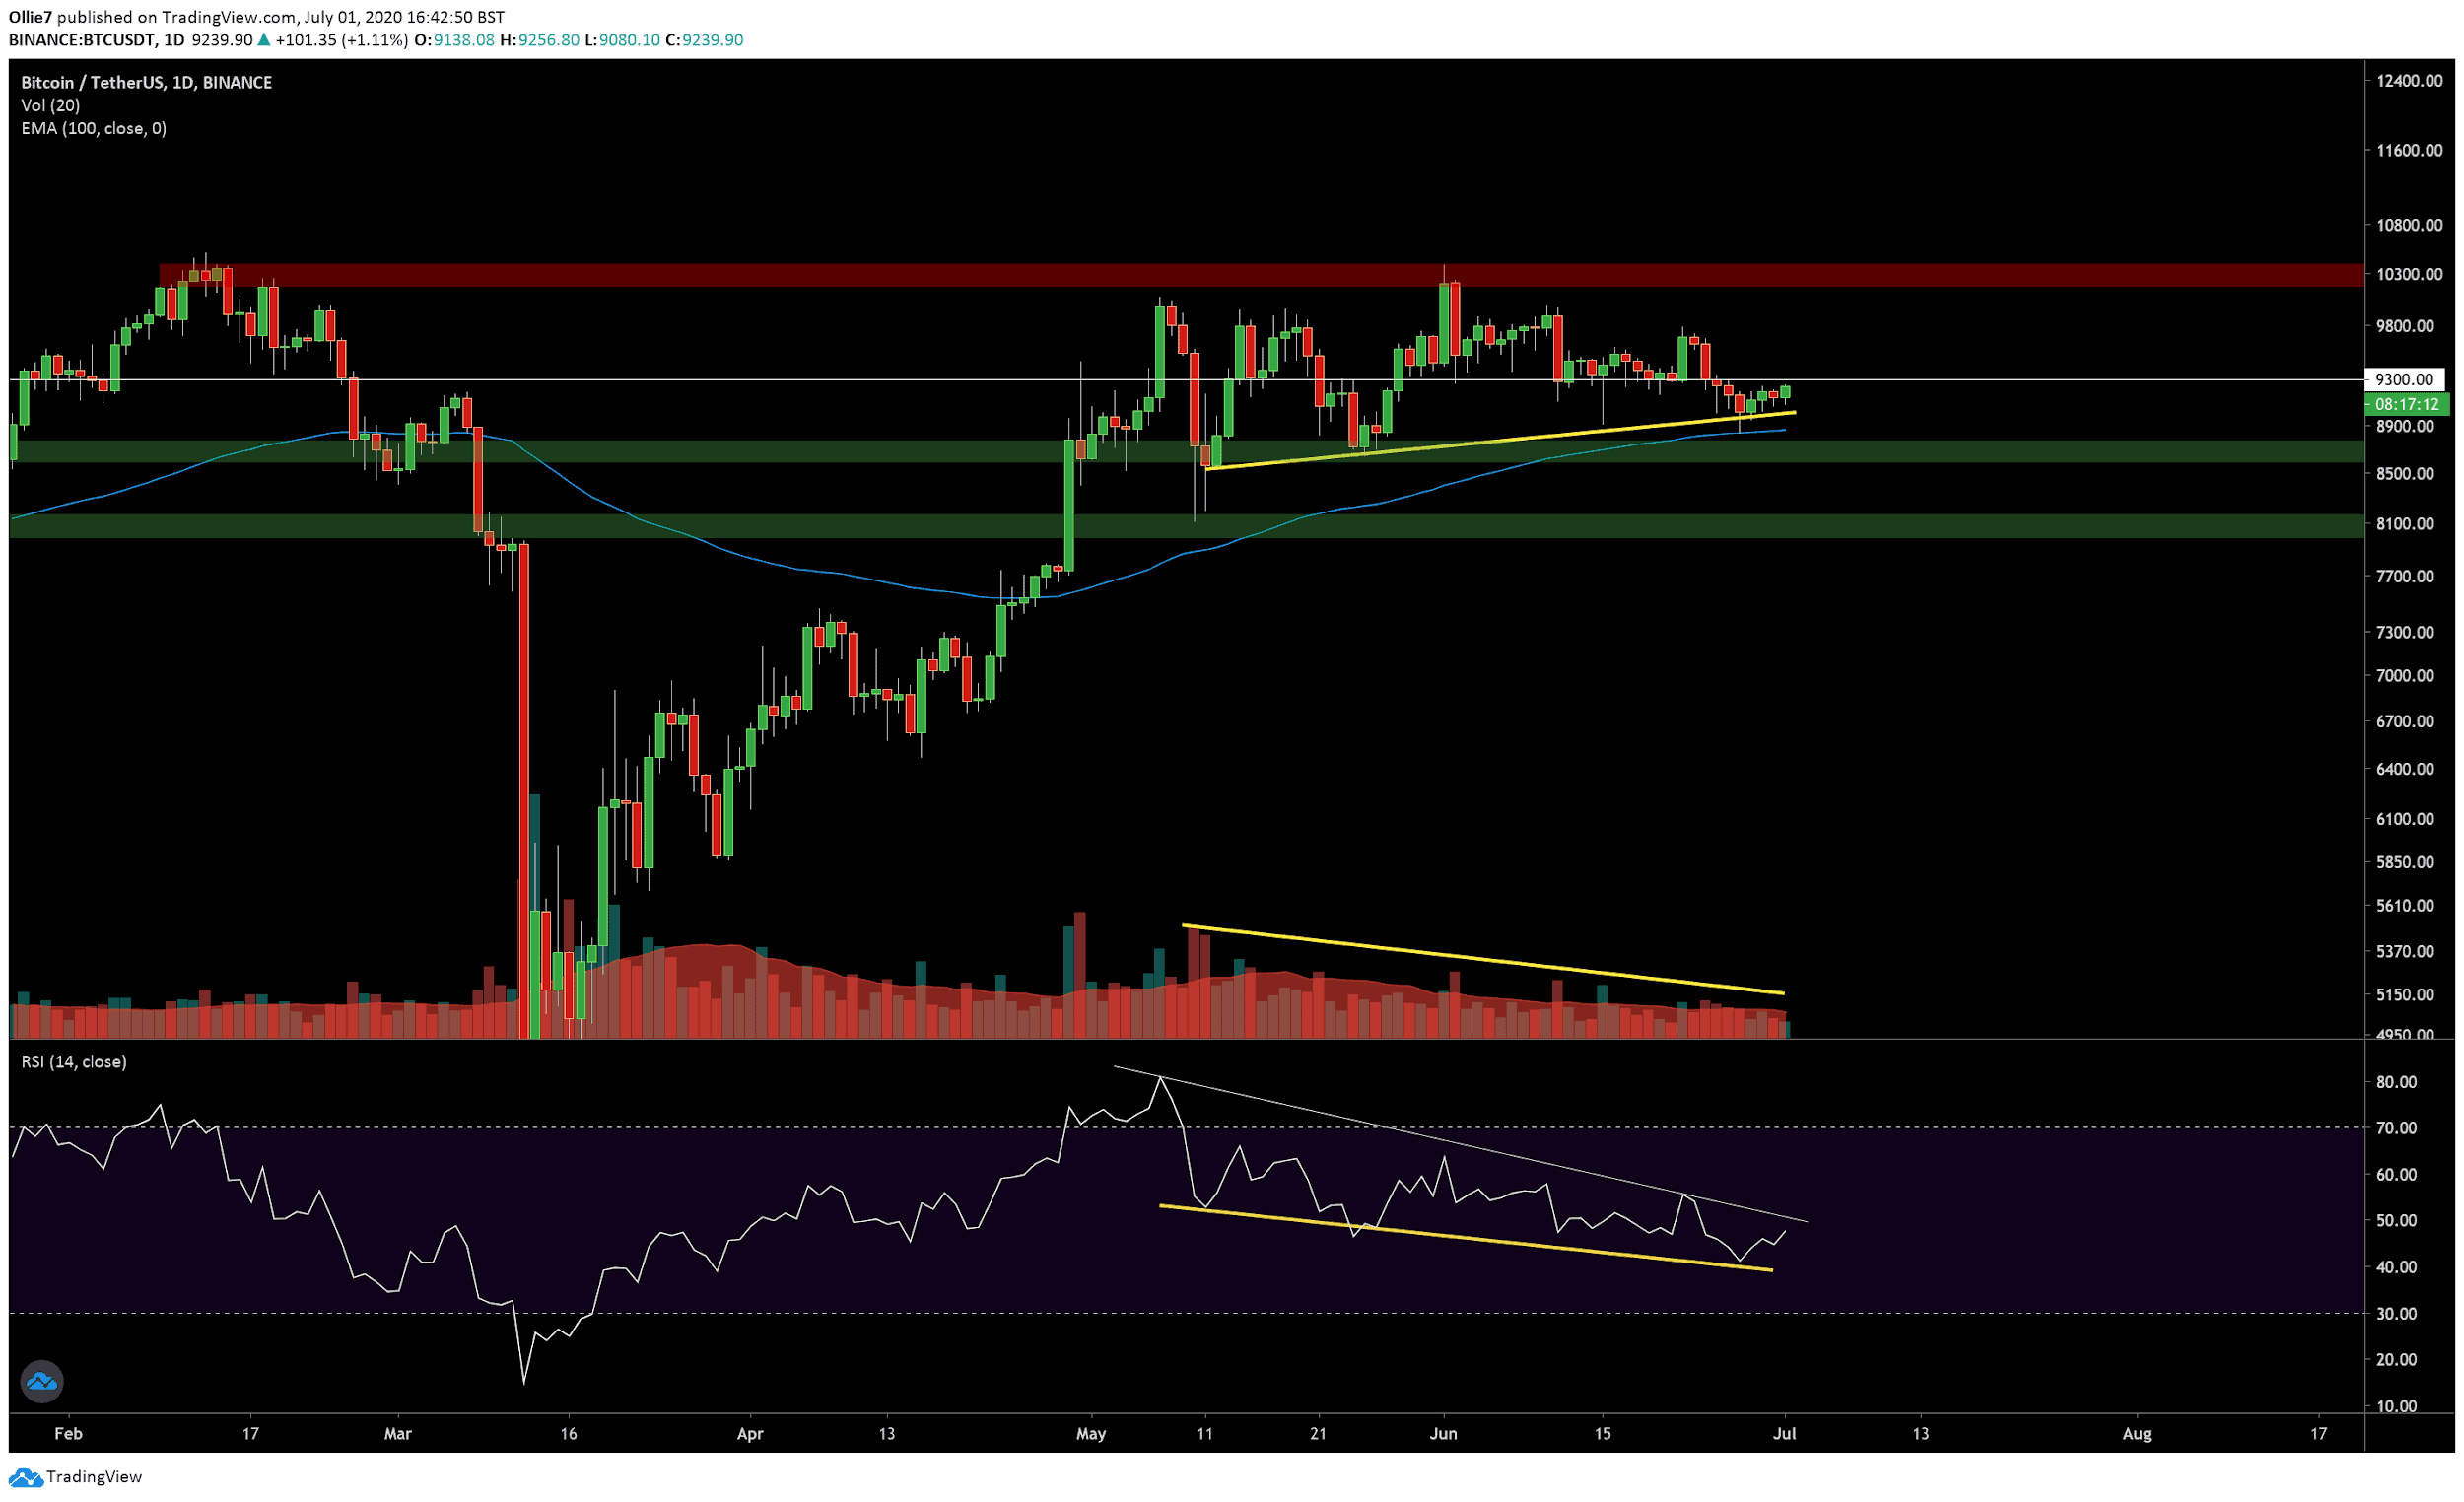
On the 1D BTC/USD chart, we can see that the leading crypto-asset remains range-bound between the daily $8,600 and $10,000 levels.
Rumors earlier in the week regarding PayPal possibly adding support for Bitcoin and other cryptocurrencies on its platform, sparked a small rally but failed to fuel a much-needed breakout above a key resistance level at $9,780.
The pump was subsequently followed by a sharp sell-off below the previous weekly open at $9,300 (white line on the following chart), which will now likely act as a difficult ceiling for bullish traders to break going into the rest of this week.
This will be a vital level to watch in the short-term and should provide a good indication of how confident buyers are in the market right now.
BTC/USDT Binance Daily Chart
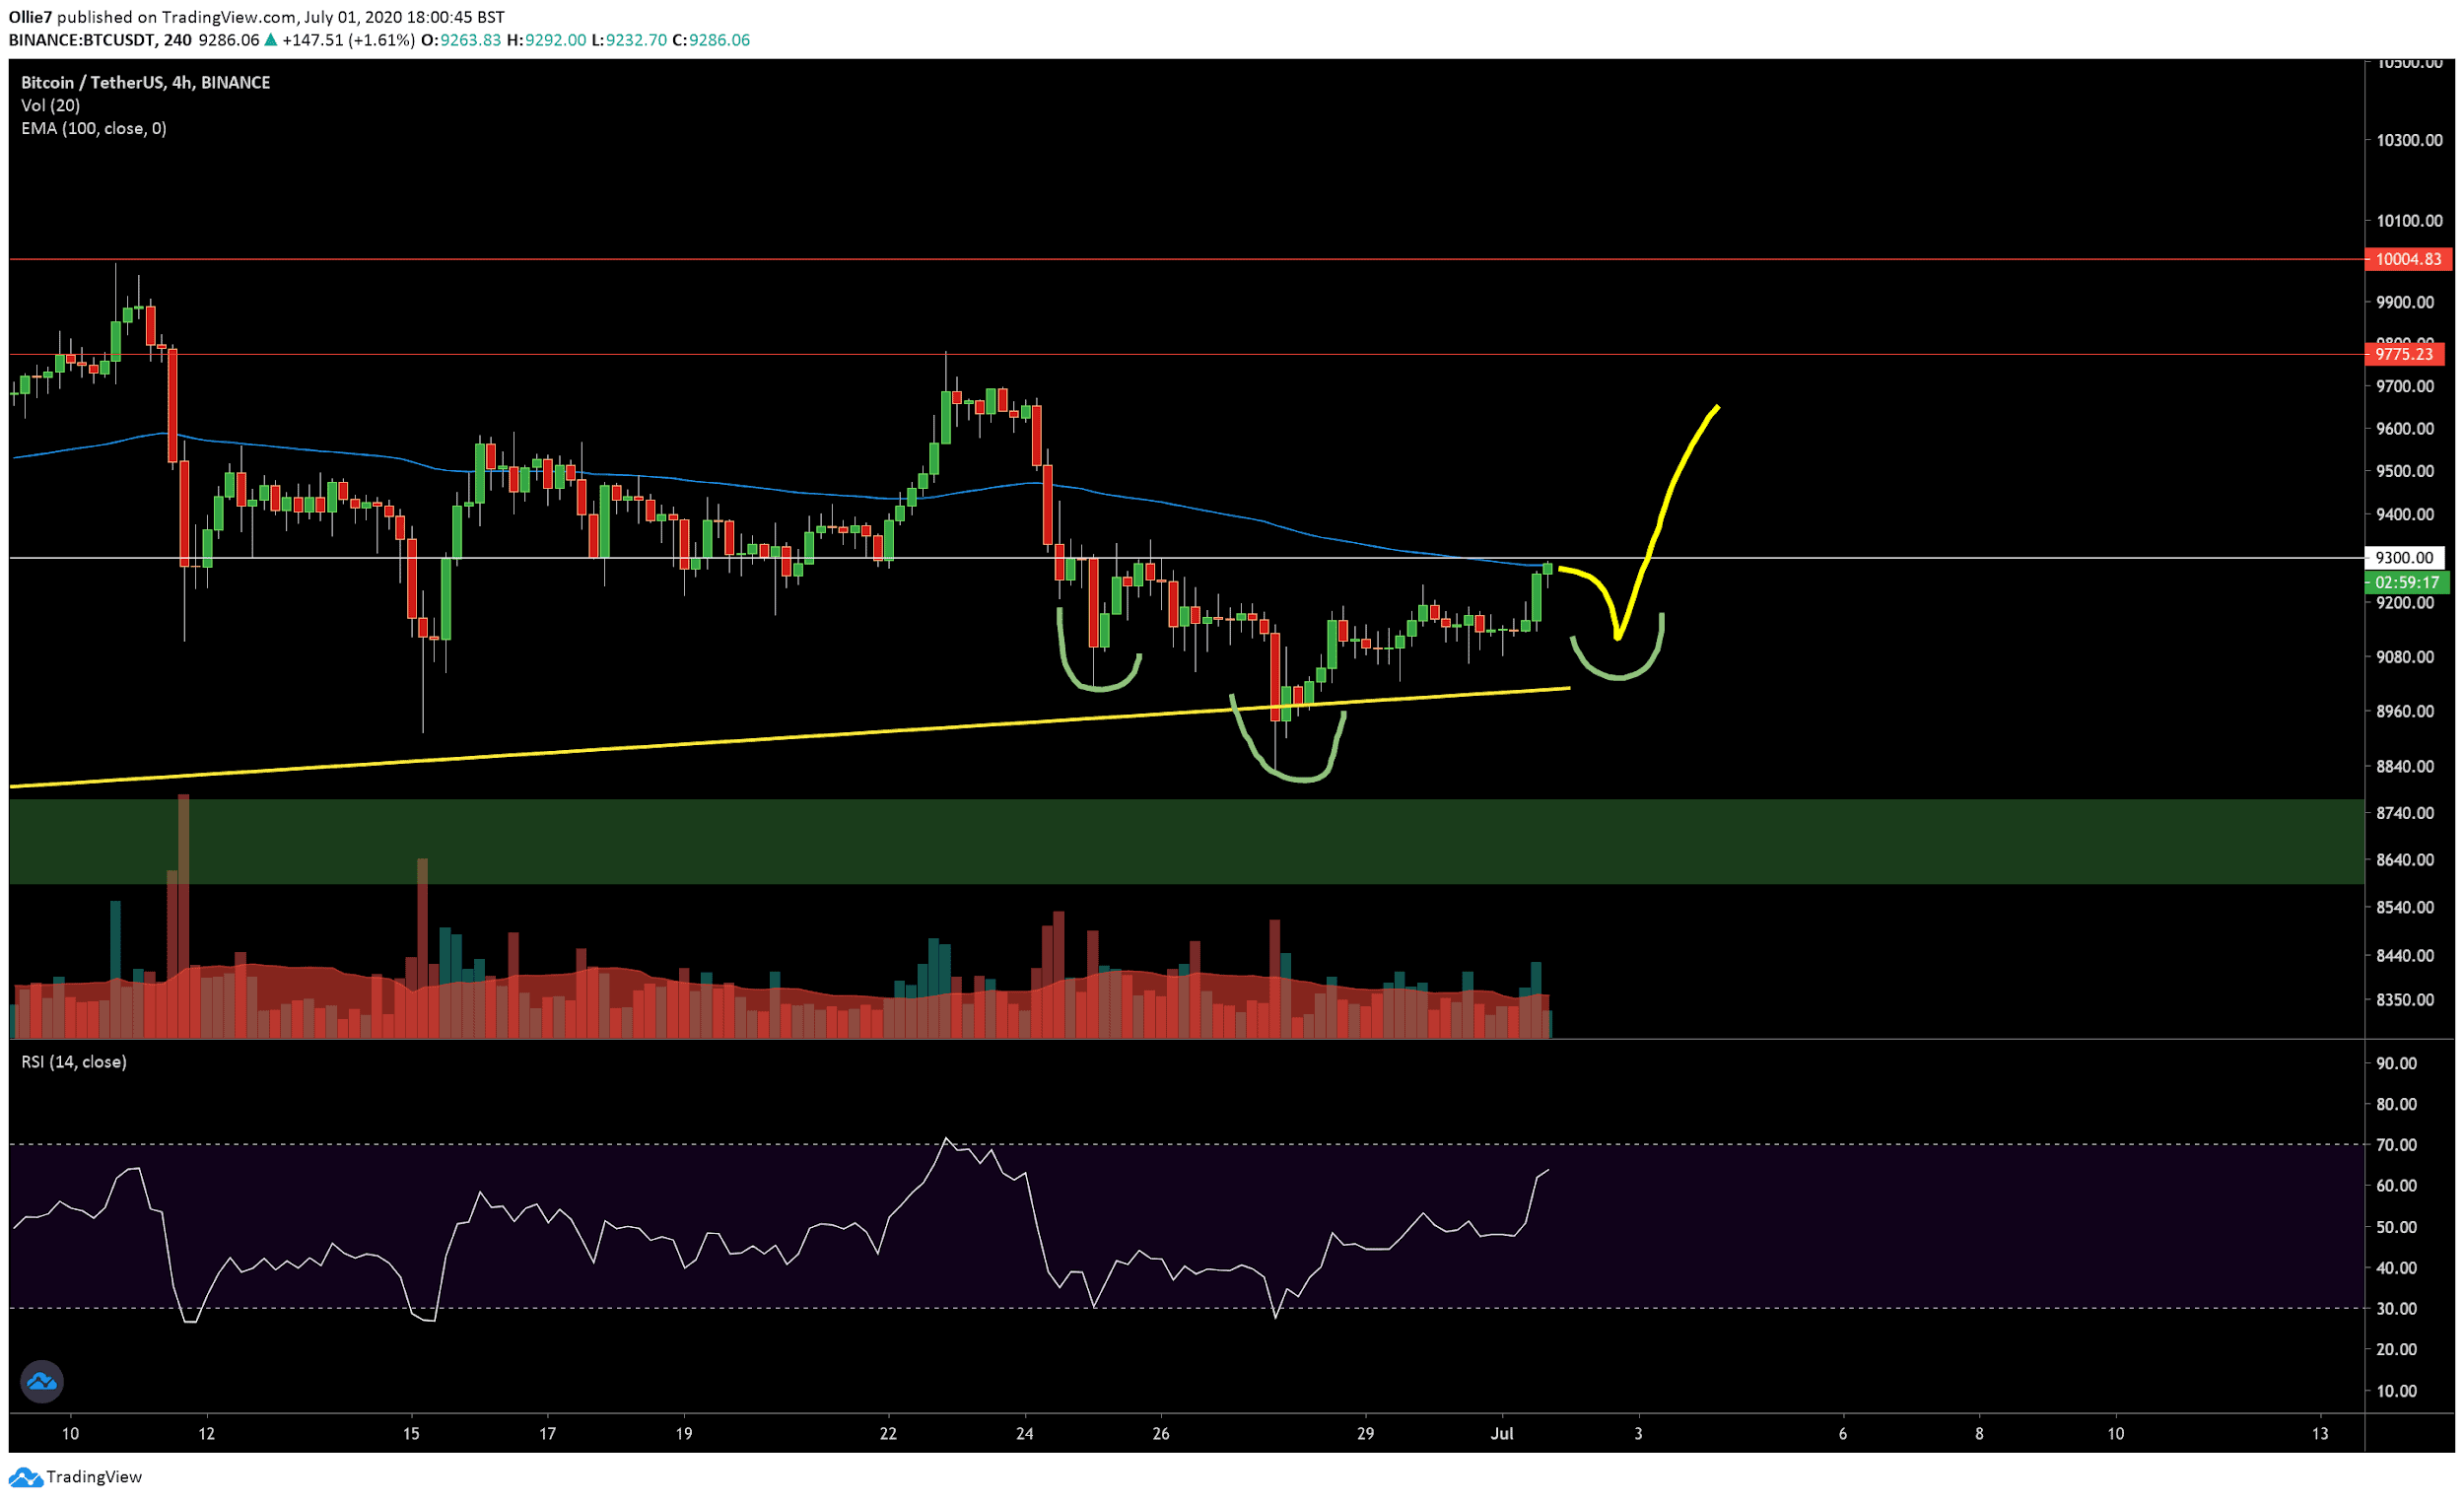
BTC/USDT Binance 4-Hour Chart
Price Levels to Watch in the Short-term
The $9,770 – $9,800 resistance appears to be the most likely bull target in the short-term, and is only a 4.4% move from the current market price (at press time). If this is broken, bulls may even push further for the psychological $10,000 level.
On the above 4H BTC/USDT chart, we can even see the potential for a bullish inverse head and shoulders pattern which could propel prices if the pattern is completed.
If bullish traders fail to retake the $9,300 level, then there are a handful of crucial supports further down that could provide opportunities for BTC to rebound.
The first is the up-trending support (yellow line) that connects all the higher lows on the BTC/USD chart since May 12, 2020. Right now, this level sits approximately at $8,965 and may provide an early foothold for buyers to recover from.
The second significant support to keep an eye on is the 100-days Exponential Moving Average (EMA, blue line). This currently sits at $8,850 and recently caught the falling price action during the ~$400 crash on Saturday.
Finally, we have a support area (green) between $8,560 and $8,770 from the order block way back on April 30, 2020. This has provided very strong support for Bitcoin on two previous occasions – May 11 and 25 – and would likely prop up the price action for the third time.
The Technicals
The leading technical indicator that supports a bearish breakout in the short-term is a strong divergence on the RSI (yellow line).
As you can see, the yellow line beneath BTC price action since May 11 shows consistently higher lows. However, on the RSI during the same period, it has made consistently lower lows.
This discrepancy usually shows that the ‘bullish’ trend is weakening and suggests that bullish traders are becoming exhausted.
Trading volume on the daily BTC/USD has also been declining, which either suggests a period of consolidation before a much larger move or that bullish sentiment is waning.
Total Market Cap: $266 Billion
Bitcoin Market Cap: $170 Billion
Bitcoin Dominance Index: 63.9%