Over the past two days, Bitcoin (BTC) price maintained the same 00 – 00 trading area that followed its price action for quite some time.Bitcoin is known for its volatility and does not tend to stay at one place for long, or trade at a tight range of 3-4% for days already.As we can see on the following 4-hour chart, the Bitcoin price is forming a giant symmetrical triangle for almost a month. This triangle apex is expected sometime in the next week; however, a breakout can occur at any time, usually before the apex itself.Anyways, a decision has soon to be made, also judging by the declining amount of trading volume.What’s Next?Symmetrical triangles have chances to break either way. However, we need to keep in mind that Bitcoin is now facing the top angle of the triangle as
Topics:
Yuval Gov considers the following as important: Bitcoin (BTC) Price, BTC Analysis, btcusd, btcusdt
This could be interesting, too:
Chayanika Deka writes XRP, SOL, and ADA Inclusion in US Crypto Reserve Pushes Traders on Edge
Chayanika Deka writes Why Arthur Hayes Is Bullish on Bitcoin Under Trump’s Economic Strategy
Mandy Williams writes Why the Bitcoin Market Is Stuck—and the Key Metric That Could Change It: CryptoQuant CEO
Wayne Jones writes Metaplanet Acquires 156 BTC, Bringing Total Holdings to 2,391
Over the past two days, Bitcoin (BTC) price maintained the same $9200 – $9500 trading area that followed its price action for quite some time.
Bitcoin is known for its volatility and does not tend to stay at one place for long, or trade at a tight range of 3-4% for days already.
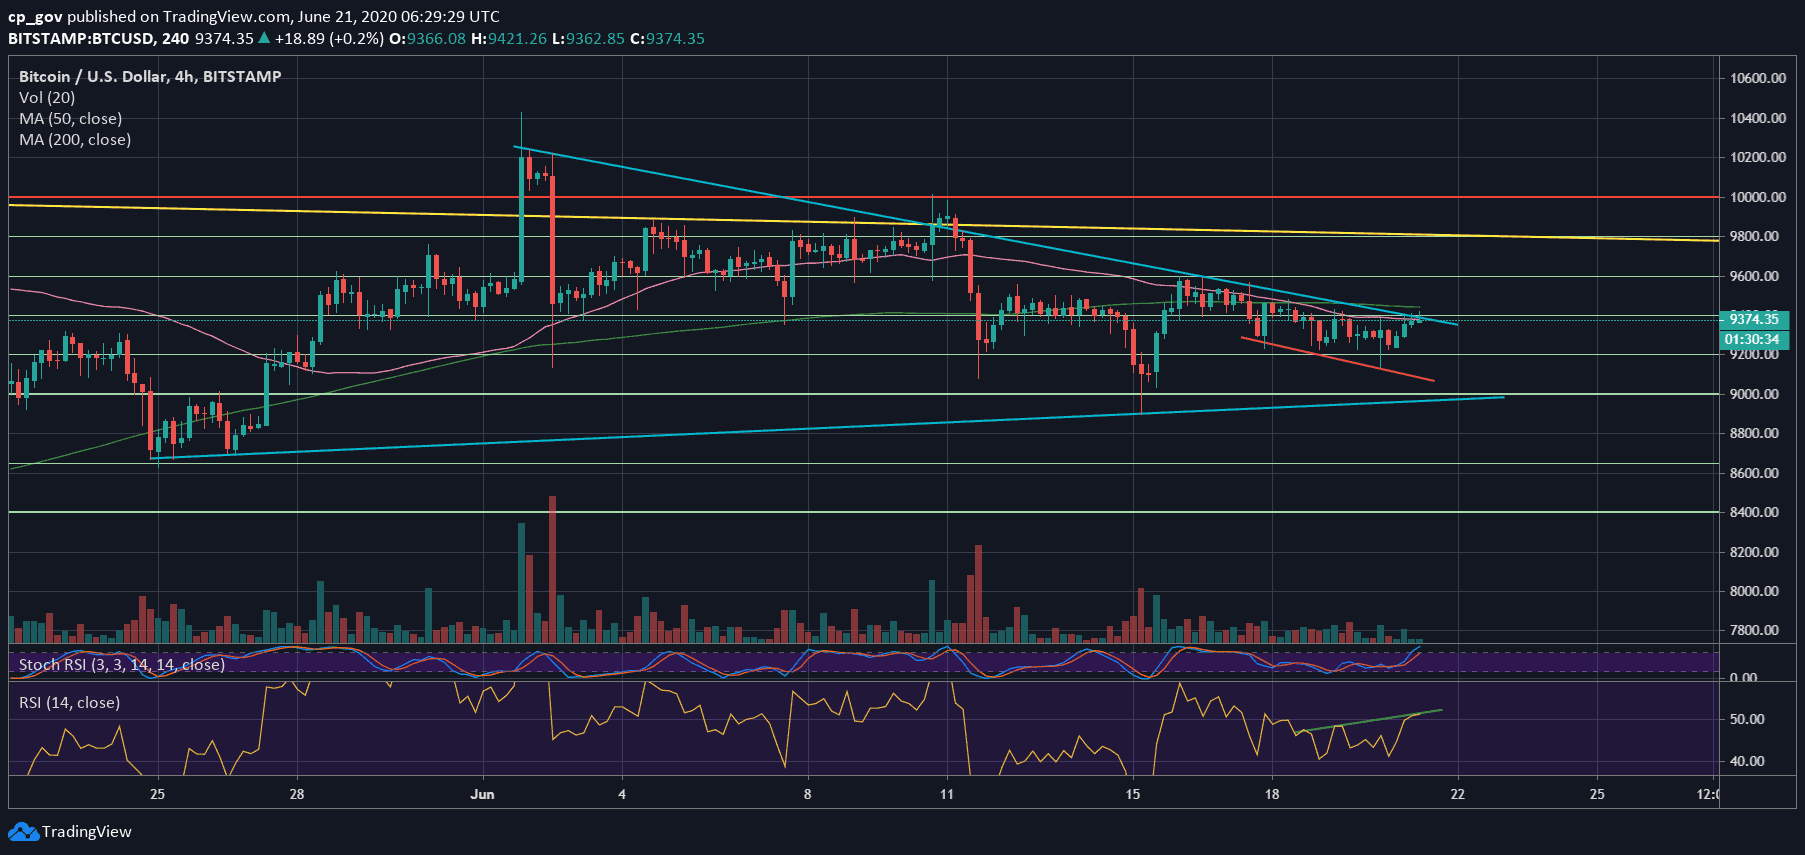
As we can see on the following 4-hour chart, the Bitcoin price is forming a giant symmetrical triangle for almost a month. This triangle apex is expected sometime in the next week; however, a breakout can occur at any time, usually before the apex itself.
Anyways, a decision has soon to be made, also judging by the declining amount of trading volume.
What’s Next?
Symmetrical triangles have chances to break either way. However, we need to keep in mind that Bitcoin is now facing the top angle of the triangle as resistance, along with the $9400 mark, which had been a tough resistance for Bitcoin over the past week.
Looking at the 4-hour RSI, we can identify a hidden bearish divergence, whereas the price is going through lower highs while the RSI indicator is going through higher highs. This might indicate on an upcoming bearish move.
Another thing to keep in mind is the correlation between the Bitcoin price and the markets. Bitcoin might be waiting to see how Wall Street futures would open (Sunday afternoon U.S. time) and act accordingly.
Key Support and Resistance Levels
As mentioned above, the first significant resistance now lies at $9400, along with the triangles upper trend-line (marked blue on the 4-hour chart) and the 50-days moving average line (the pink line).
In case of a breakout, we can expect Bitcoin to reach $9500 – $9600 quickly. Further above lies the daily chart’s yellow descending trend-line, currently around $9800.
From below, the first significant support level is $9200, followed by $9130 and $9000. Further below lies the $8900 – $9000 area, which is also this week’s low.
Total Market Cap: $265.8 billion
Bitcoin Market Cap: $172 billion
BTC Dominance Index: 64.8%
*Data by CoinGecko
BTC/USD BitStamp 4-Hour Chart
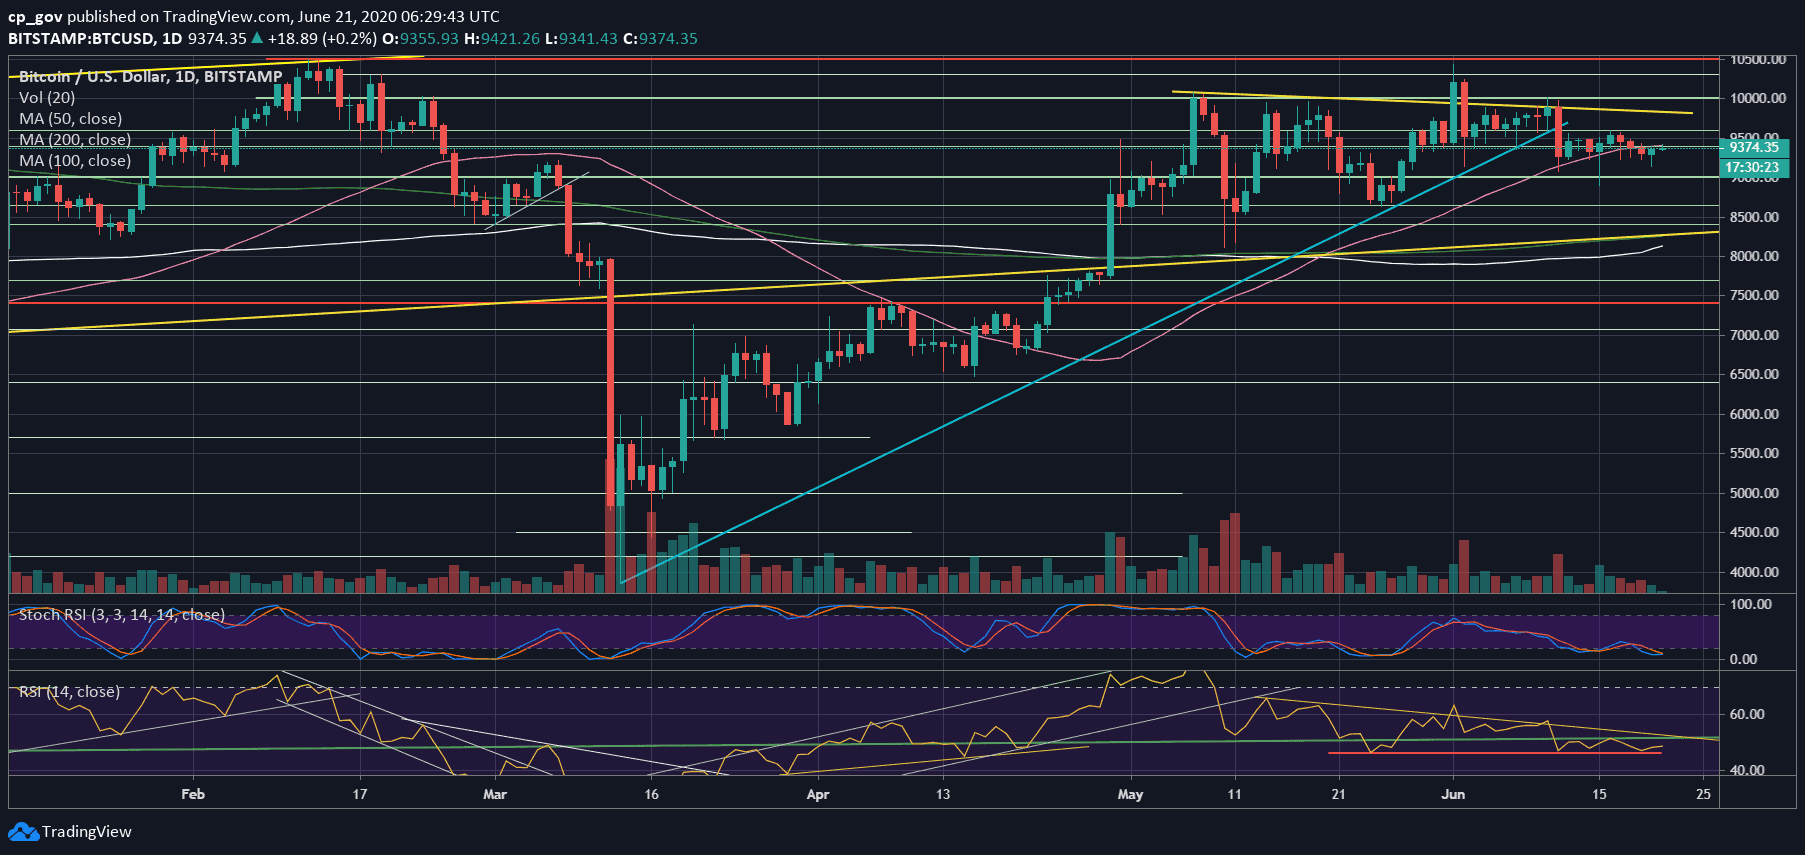
BTC/USD BitStamp 1-Day Chart