As another week comes to its end, let’s start from the bottom line: Bitcoin price ends the week exactly where it started it, hovering around the ,600 mark.It wasn’t a remarkable week for Bitcoin, unlike the other cryptocurrencies, especially the DeFi ones, that saw triple-digit gains.Looking at the shorter timeframe, which is seen on the following 4-hour chart, Bitcoin had formed a double-bottom around ,100. The latter is considered to be a bullish pattern unless the bottom is broken below.Shortly after, and for the past three days, Bitcoin was locked again inside the tight range between ,400 and ,600. As long as Bitcoin is stagnant, we can assume that the alt-season or the defi-season will continue higher.However, a declining amount of trading volume, along with the stability
Topics:
Yuval Gov considers the following as important: Bitcoin (BTC) Price, BTC Analysis, BTCEUR, BTCGBP, btcusd, btcusdt
This could be interesting, too:
Chayanika Deka writes XRP, SOL, and ADA Inclusion in US Crypto Reserve Pushes Traders on Edge
Chayanika Deka writes Why Arthur Hayes Is Bullish on Bitcoin Under Trump’s Economic Strategy
Mandy Williams writes Why the Bitcoin Market Is Stuck—and the Key Metric That Could Change It: CryptoQuant CEO
Wayne Jones writes Metaplanet Acquires 156 BTC, Bringing Total Holdings to 2,391
As another week comes to its end, let’s start from the bottom line: Bitcoin price ends the week exactly where it started it, hovering around the $10,600 mark.
It wasn’t a remarkable week for Bitcoin, unlike the other cryptocurrencies, especially the DeFi ones, that saw triple-digit gains.
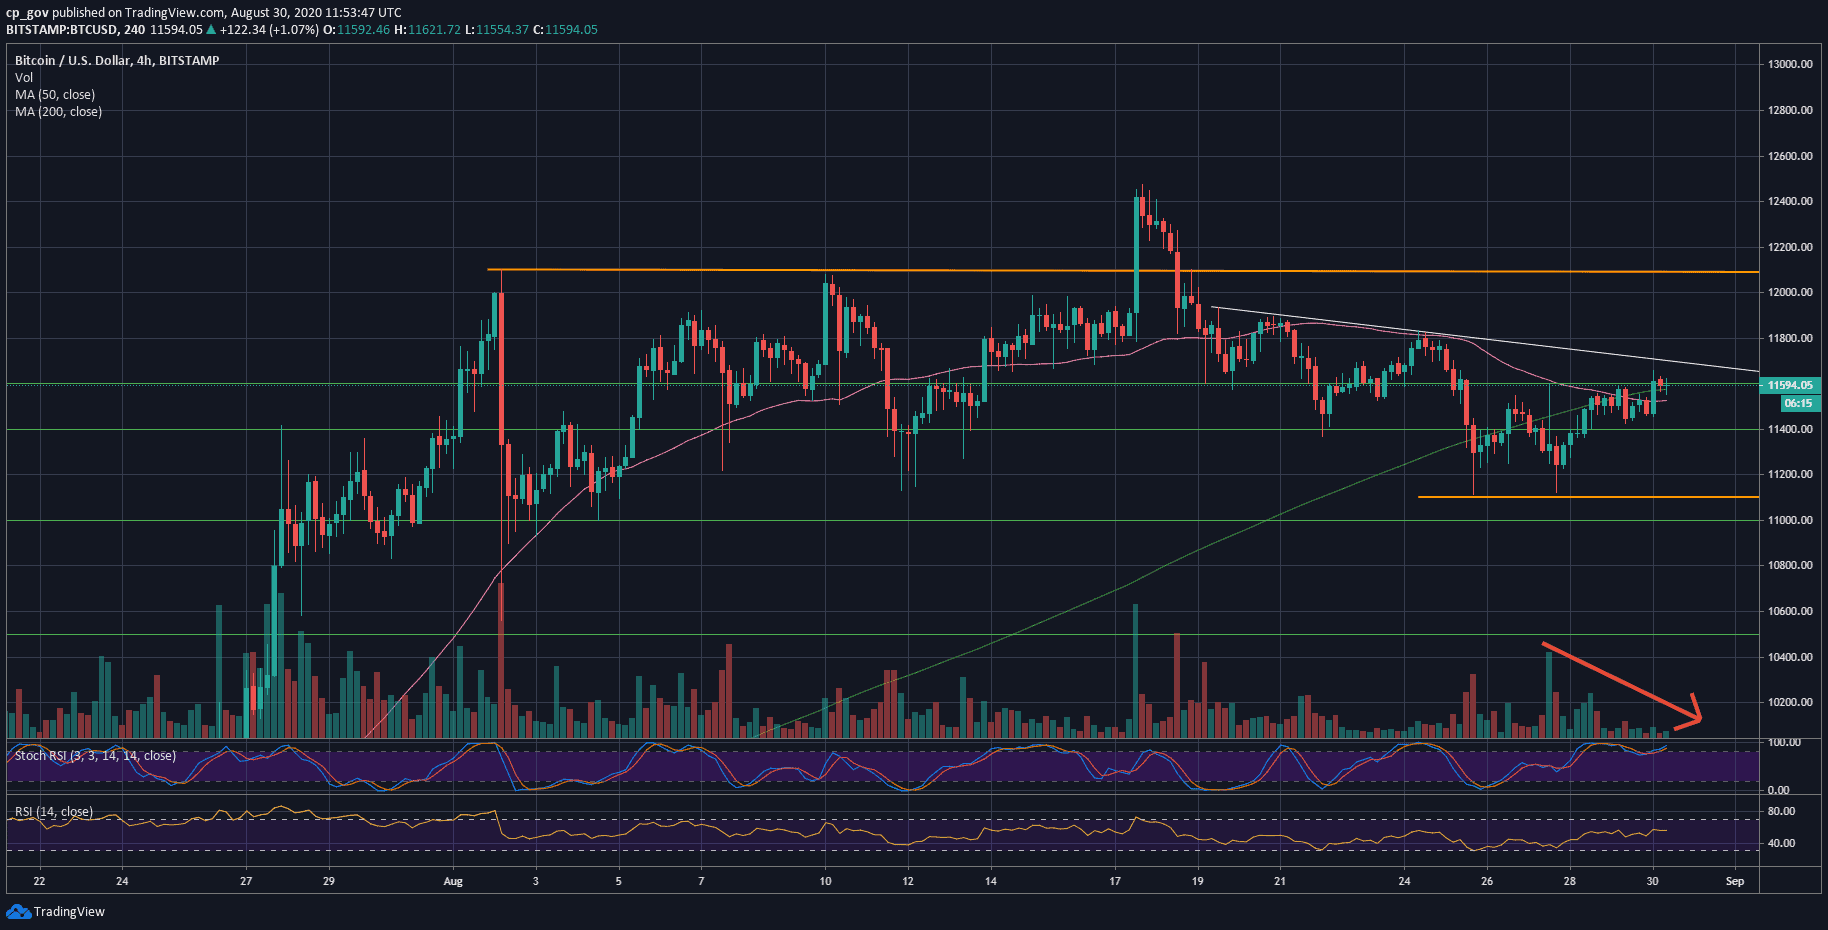
Looking at the shorter timeframe, which is seen on the following 4-hour chart, Bitcoin had formed a double-bottom around $11,100. The latter is considered to be a bullish pattern unless the bottom is broken below.
Shortly after, and for the past three days, Bitcoin was locked again inside the tight range between $11,400 and $11,600. As long as Bitcoin is stagnant, we can assume that the alt-season or the defi-season will continue higher.
However, a declining amount of trading volume, along with the stability of BTC, is likely to produce a strong move to either side. This might also be aligned with the start of a new week tomorrow.
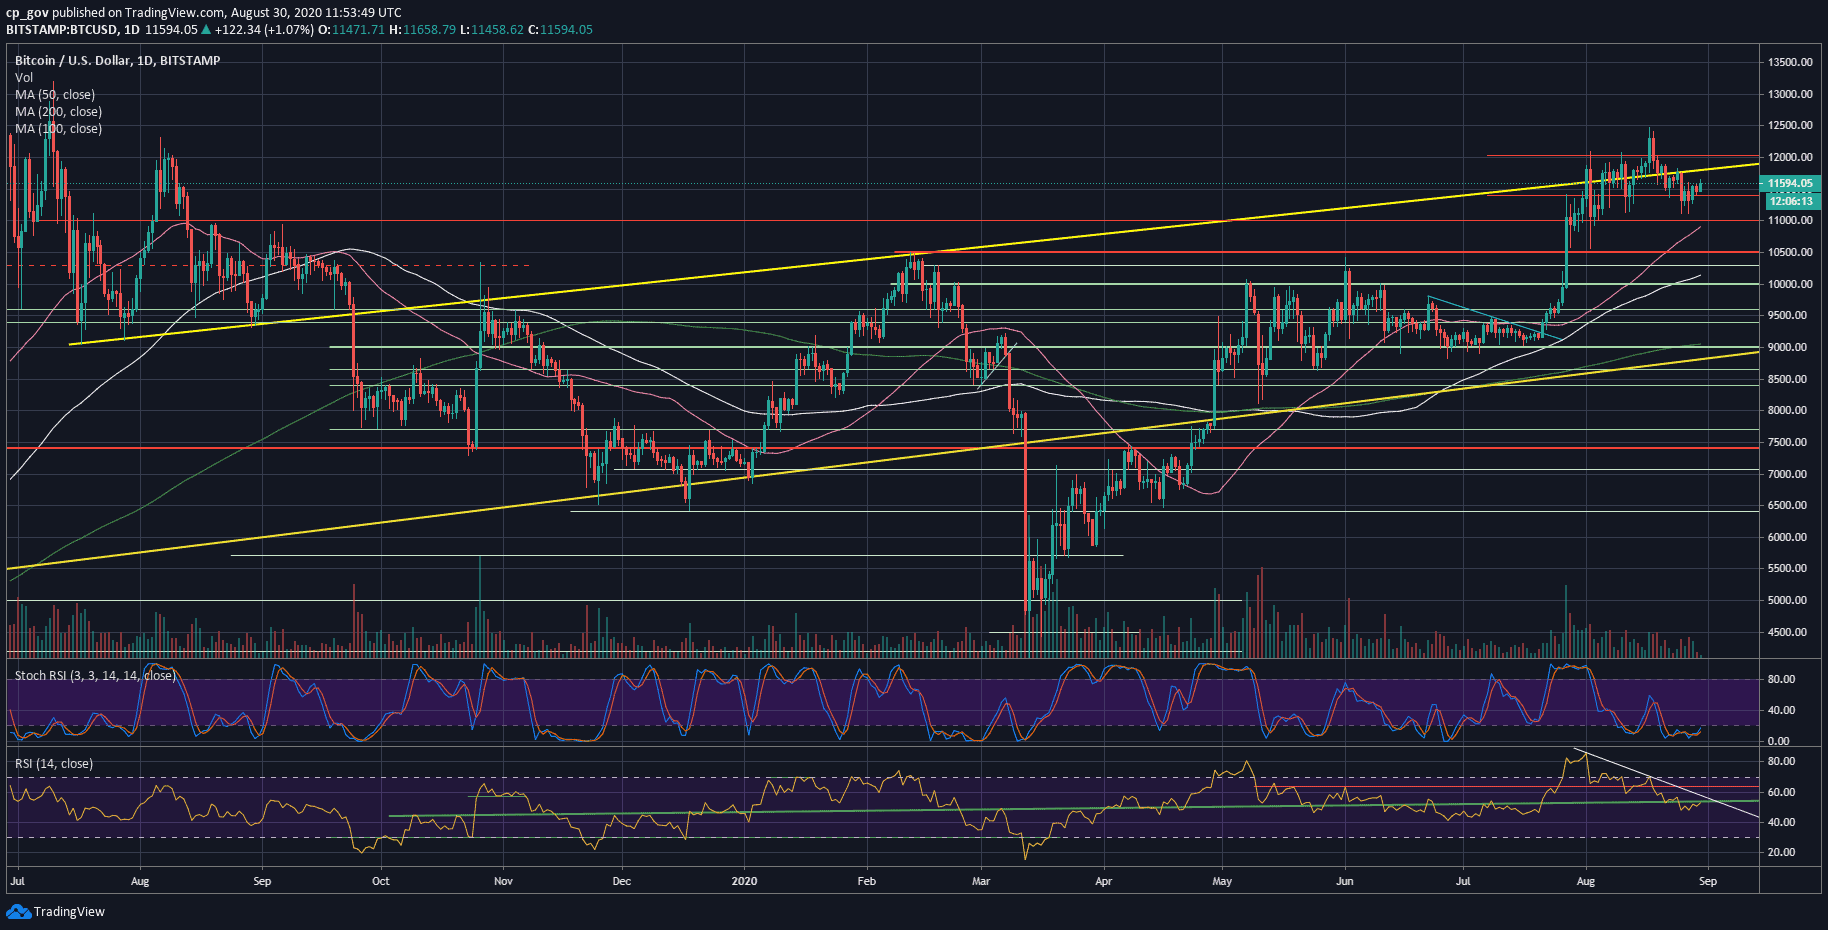
In my opinion, the breakout direction can be to either side. From a bullish perspective, usually after an altcoin run, BTC closes on the range. Besides, the Stochastic RSI oscillator on the daily is about to complete a bullish crossover at the oversold territory.
From a bearish perspective, the daily RSI is patterning a lower high bearish trajectory, along with the low volume we had seen when Bitcoin was trading above $12,000.
Key Support and Resistance For Bitcoin’s Short-term
As of writing these lines, Bitcoin finds trouble to overcome the $11,600 resistance level. In case of a breakup, and we can expect the next resistance at $11,800, which is the past week’s high reached on Monday.
Further above lies the real resistance at $12,000 – $12,100, followed by the 2020 high at $12,500.
From below, the first level of support is the $11,400 area. In case of a breakdown, then the next major level is the past week’s double bottom at $11,100, followed by $11,000, $10,800 and $10,500 (the previous yearly high).
Total Market Cap: $383 billion
Bitcoin Market Cap: $214 billion
BTC Dominance Index: 55.9%
*Data by CoinGecko
BTC/USD BitStamp 1-Day Chart
BTC/USD BitStamp 4-Hour Chart