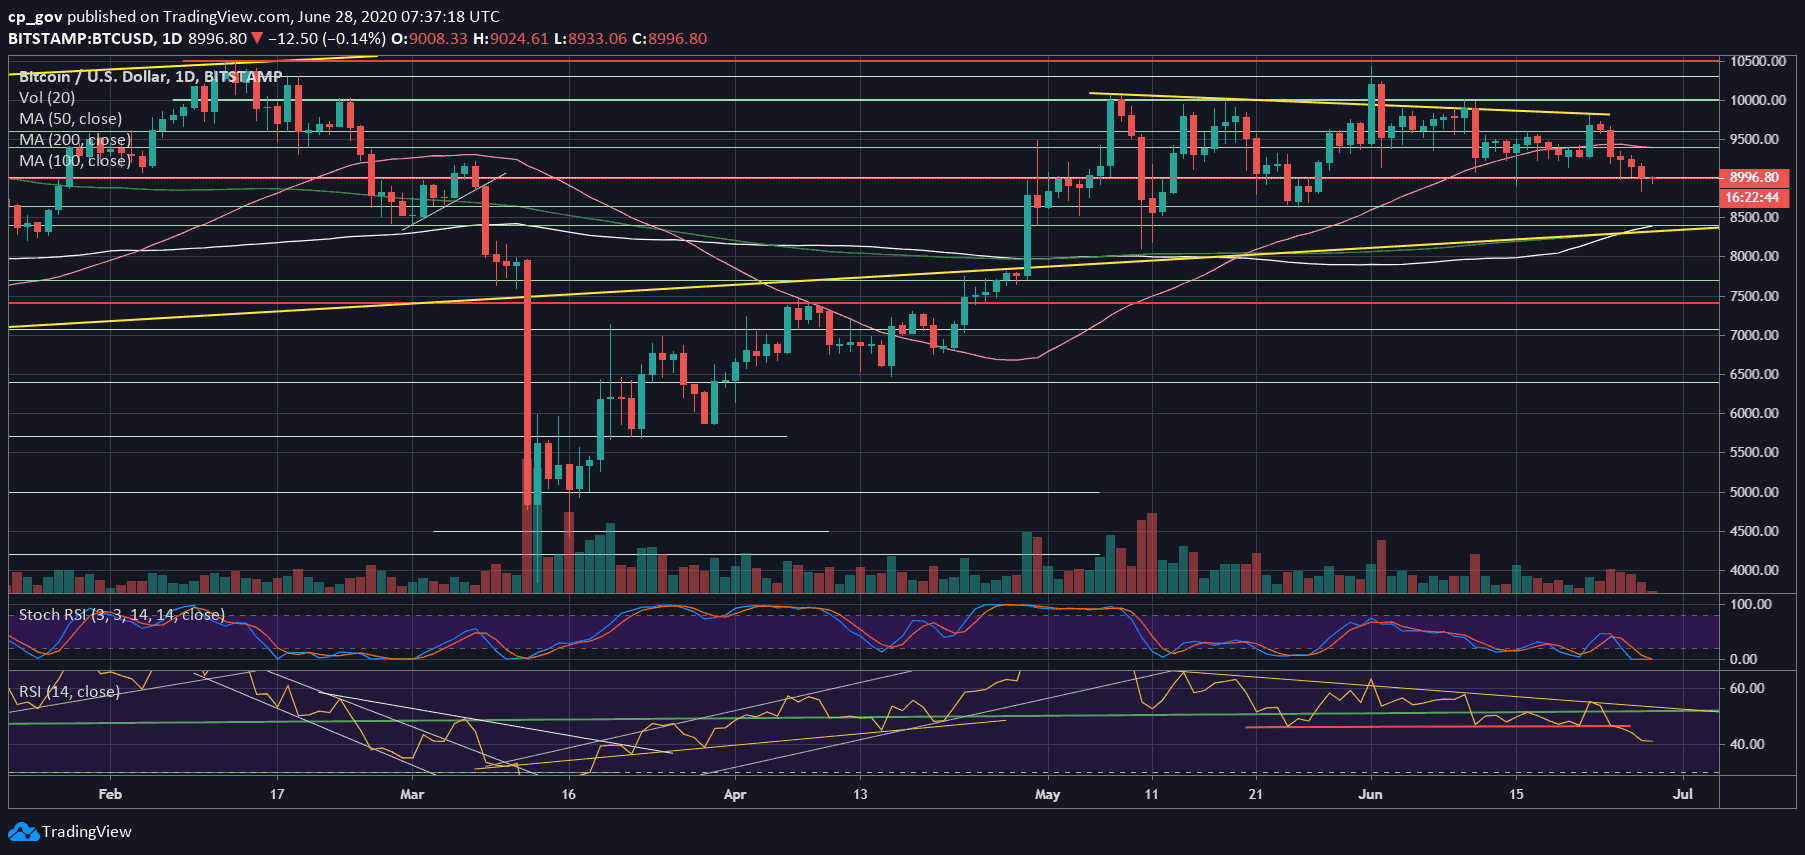
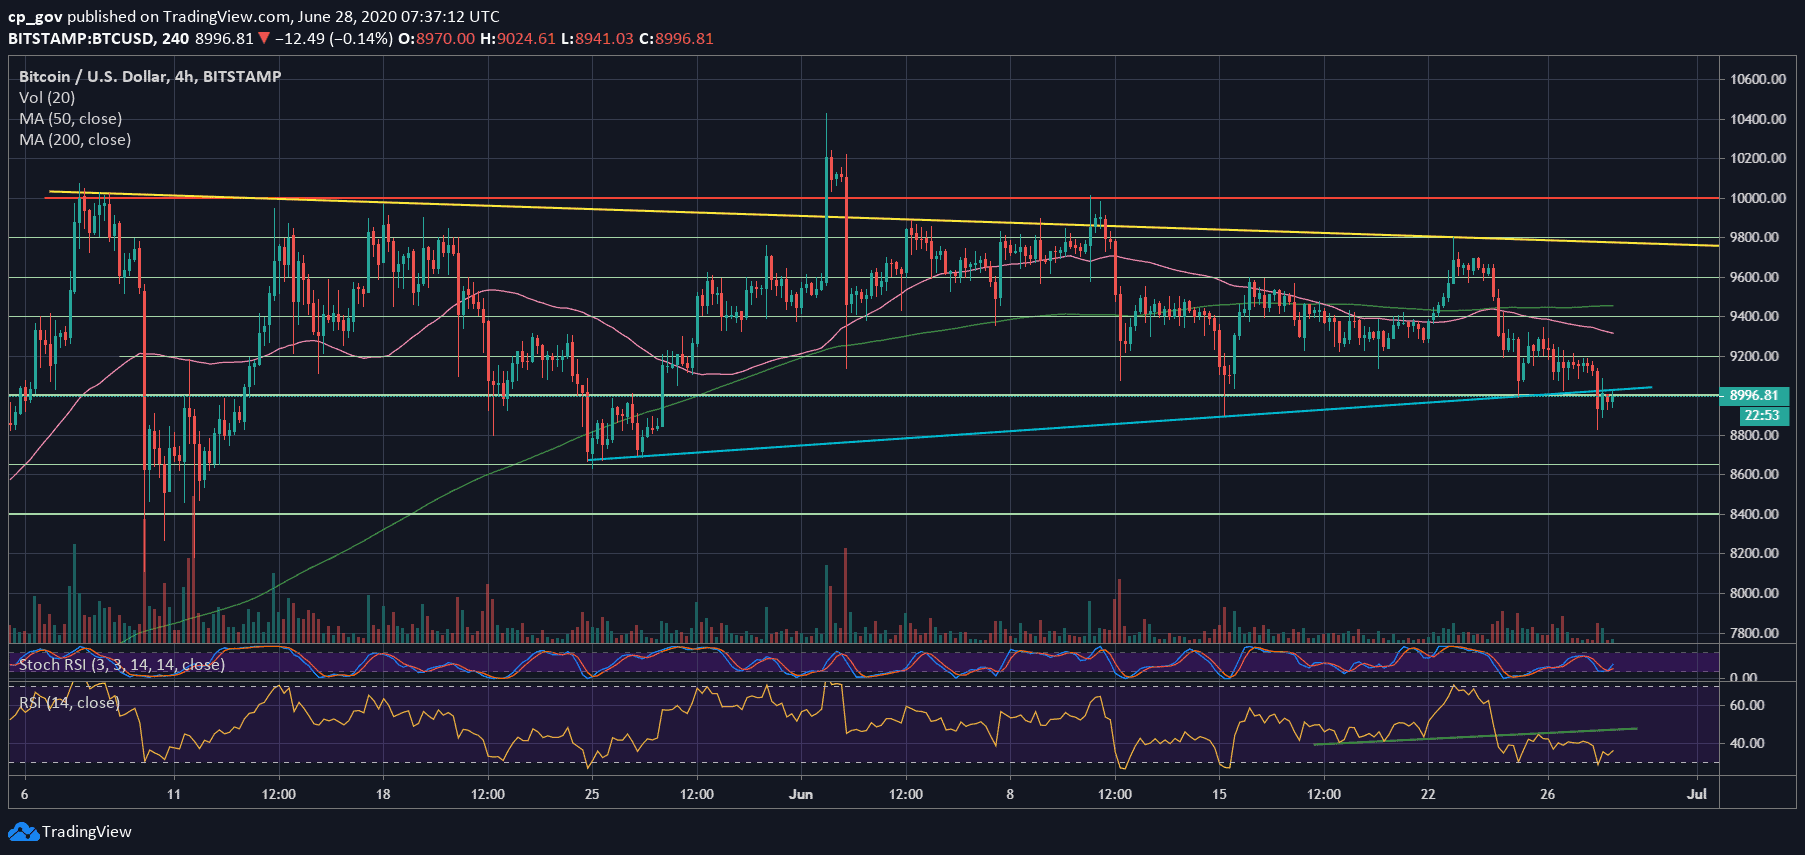
So far, this weekend hadn’t been the best for the price of Bitcoin. The primary cryptocurrency recorded its lowest level over the last 30 days.Trading for 00 just six days ago, Bitcoin dropped as of yesterday to nearly 00 on most leading exchanges.The Good and The Bad NewsAs of writing these lines, Bitcoin is trading around the K mark, mostly below it. From a technical point of view, a strong support level that got broken down immediately becomes a huge resistance level.As can be seen on the following 4-hour chart, once Bitcoin broke the critical blue ascending trend-line as support, it is now retesting it as resistance, and, as expected, it is an easy battle for BTC.If Bitcoin fails here, and cannot regain possession above the K, we can expect a further drop to new monthly lows.
Topics:
Yuval Gov considers the following as important: Bitcoin (BTC) Price, BTC Analysis, btcusd, btcusdt
This could be interesting, too:
Chayanika Deka writes XRP, SOL, and ADA Inclusion in US Crypto Reserve Pushes Traders on Edge
Chayanika Deka writes Why Arthur Hayes Is Bullish on Bitcoin Under Trump’s Economic Strategy
Mandy Williams writes Why the Bitcoin Market Is Stuck—and the Key Metric That Could Change It: CryptoQuant CEO
Wayne Jones writes Metaplanet Acquires 156 BTC, Bringing Total Holdings to 2,391
So far, this weekend hadn’t been the best for the price of Bitcoin. The primary cryptocurrency recorded its lowest level over the last 30 days.
Trading for $9800 just six days ago, Bitcoin dropped as of yesterday to nearly $8800 on most leading exchanges.
The Good and The Bad News
As of writing these lines, Bitcoin is trading around the $9K mark, mostly below it. From a technical point of view, a strong support level that got broken down immediately becomes a huge resistance level.
As can be seen on the following 4-hour chart, once Bitcoin broke the critical blue ascending trend-line as support, it is now retesting it as resistance, and, as expected, it is an easy battle for BTC.
If Bitcoin fails here, and cannot regain possession above the $9K, we can expect a further drop to new monthly lows. On the other hand, as mentioned here yesterday and many times before, the $8900 – $9000 horizontal support level is crucial for the bulls’ short term.
From a technical point of view, the Stochastic RSI oscillator is at its oversold levels on both the 4-hour and the daily chart. This might give some fuel for a correction. Another sign to watch is the trading volume.
Despite the last days’ plunge, we can see a declining path over the past few days in means of the trading volume.
This could also be a sign that the sellers number is decreasing, and Bitcoin is set for a correction. Another bullish sign might be coming from the bearishness surrounding in crypto tweeter, which usually ends up in the opposite way (capitulation).
On the Macro level, the weekly chart is also consolidating into a decision point, and a weekly close below $9300 – $9400 will strengthen the bearishness for the next short term.
Key Support & Resistance Levels
Bitcoin is now retesting the $9000 but this time as resistance. In case it breaks down the $8900 – $9000 support, then yesterday’s low at $8800 is the very last chance before a further plunge into the mid -$8K areas, if not even a further drop.
Below $8800, the next support lies at $8650. Further down is around $8300 – $8400, which also includes the significant 200 and 100 days moving average lines (marked light-green and white on the following daily chart).
The latter also includes the long-term yellow ascending trend-line, as can be seen on the daily chart.
From above, the first significant area of resistance now lies around $9200. Further above is the $9300 (Thursday’s high), followed by the 50-days moving average line (the pink line), which lies around $9400.
Total Market Cap: $255.7 billion
Bitcoin Market Cap: $166.2 billion
BTC Dominance Index: 65.0%
*Data by CoinGecko
BTC/USD BitStamp 4-Hour Chart
BTC/USD BitStamp 1-Day Chart