After a calm and stable weekend, Bitcoin starts the new week following exciting news about Visa accepting payments in USDC.Over the past week, BTC recorded its lowest price in 2.5 weeks. This happened on Thursday.However, Bitcoin showed strength, finding support on top of the 50-day moving average line (marked pink as can be seen on the following chart) and maintaining this critical support area (around k) on a daily timeframe.Over the following days, the strong momentum continued as Bitcoin was trading primarily around -55K with candle wicks and daily closings above k. This tells us that there is a high demand below the k price area.Today, a short while before writing up this update, Bitcoin saw a huge price increase, which allowed the cryptocurrency to break above the
Topics:
Yuval Gov considers the following as important: Bitcoin (BTC) Price, BTC Analysis, BTCEUR, BTCGBP, btcusd, btcusdt
This could be interesting, too:
Chayanika Deka writes XRP, SOL, and ADA Inclusion in US Crypto Reserve Pushes Traders on Edge
Chayanika Deka writes Why Arthur Hayes Is Bullish on Bitcoin Under Trump’s Economic Strategy
Mandy Williams writes Why the Bitcoin Market Is Stuck—and the Key Metric That Could Change It: CryptoQuant CEO
Wayne Jones writes Metaplanet Acquires 156 BTC, Bringing Total Holdings to 2,391
After a calm and stable weekend, Bitcoin starts the new week following exciting news about Visa accepting payments in USDC.
Over the past week, BTC recorded its lowest price in 2.5 weeks. This happened on Thursday.
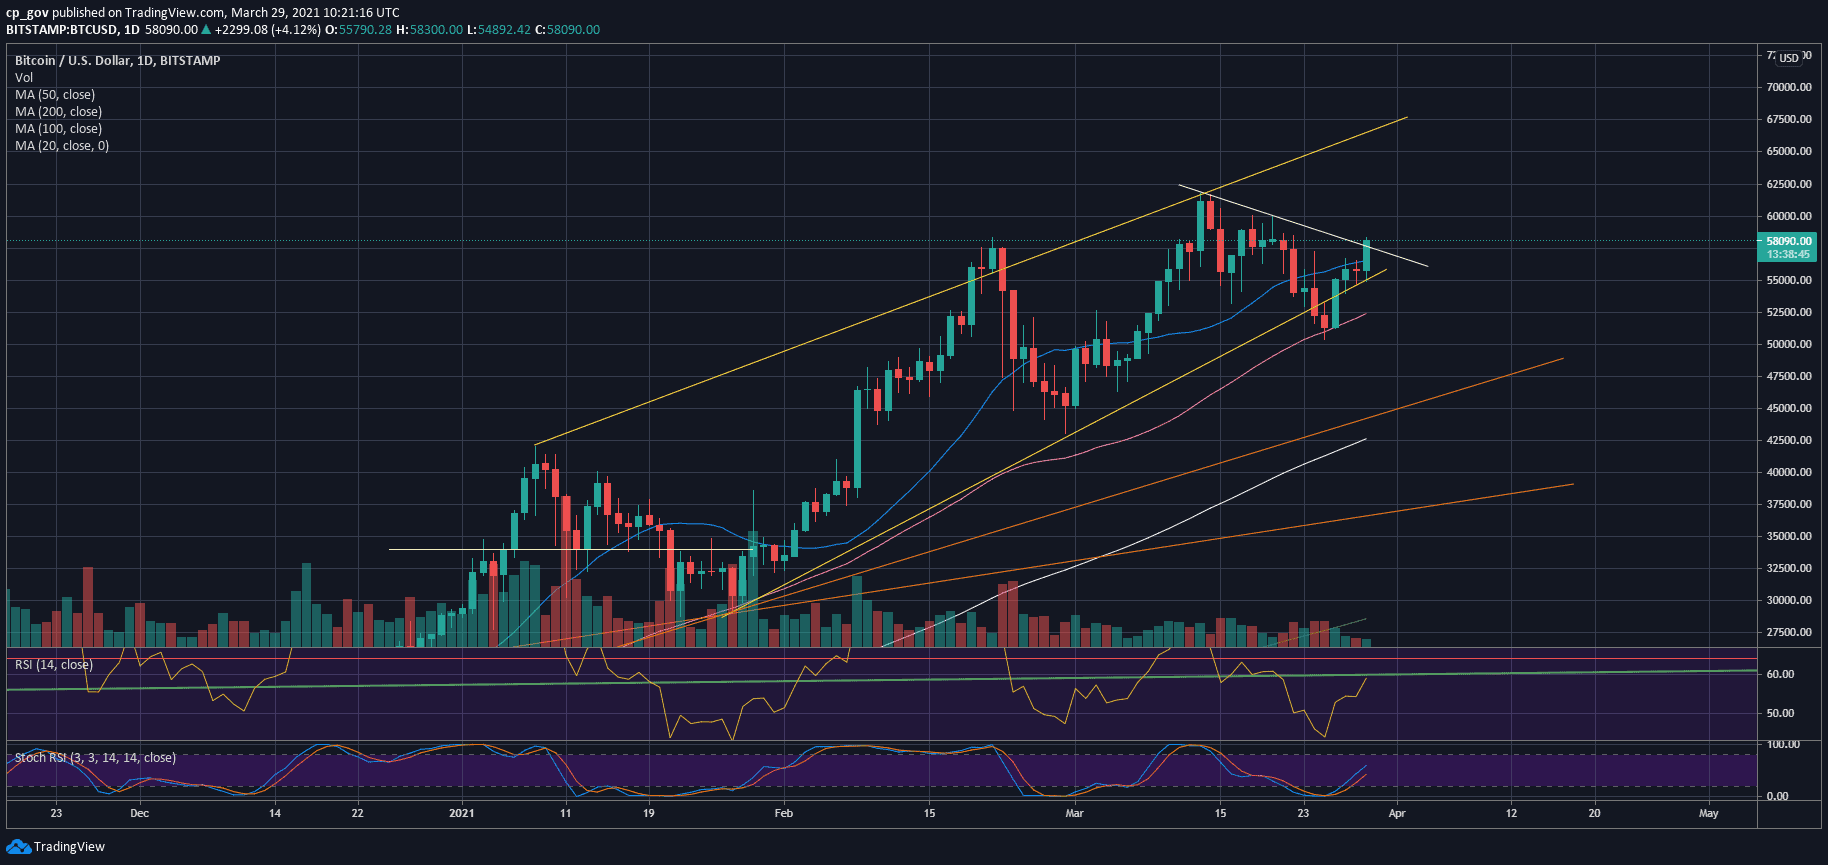
However, Bitcoin showed strength, finding support on top of the 50-day moving average line (marked pink as can be seen on the following chart) and maintaining this critical support area (around $51k) on a daily timeframe.
Over the following days, the strong momentum continued as Bitcoin was trading primarily around $54-55K with candle wicks and daily closings above $55k. This tells us that there is a high demand below the $55k price area.
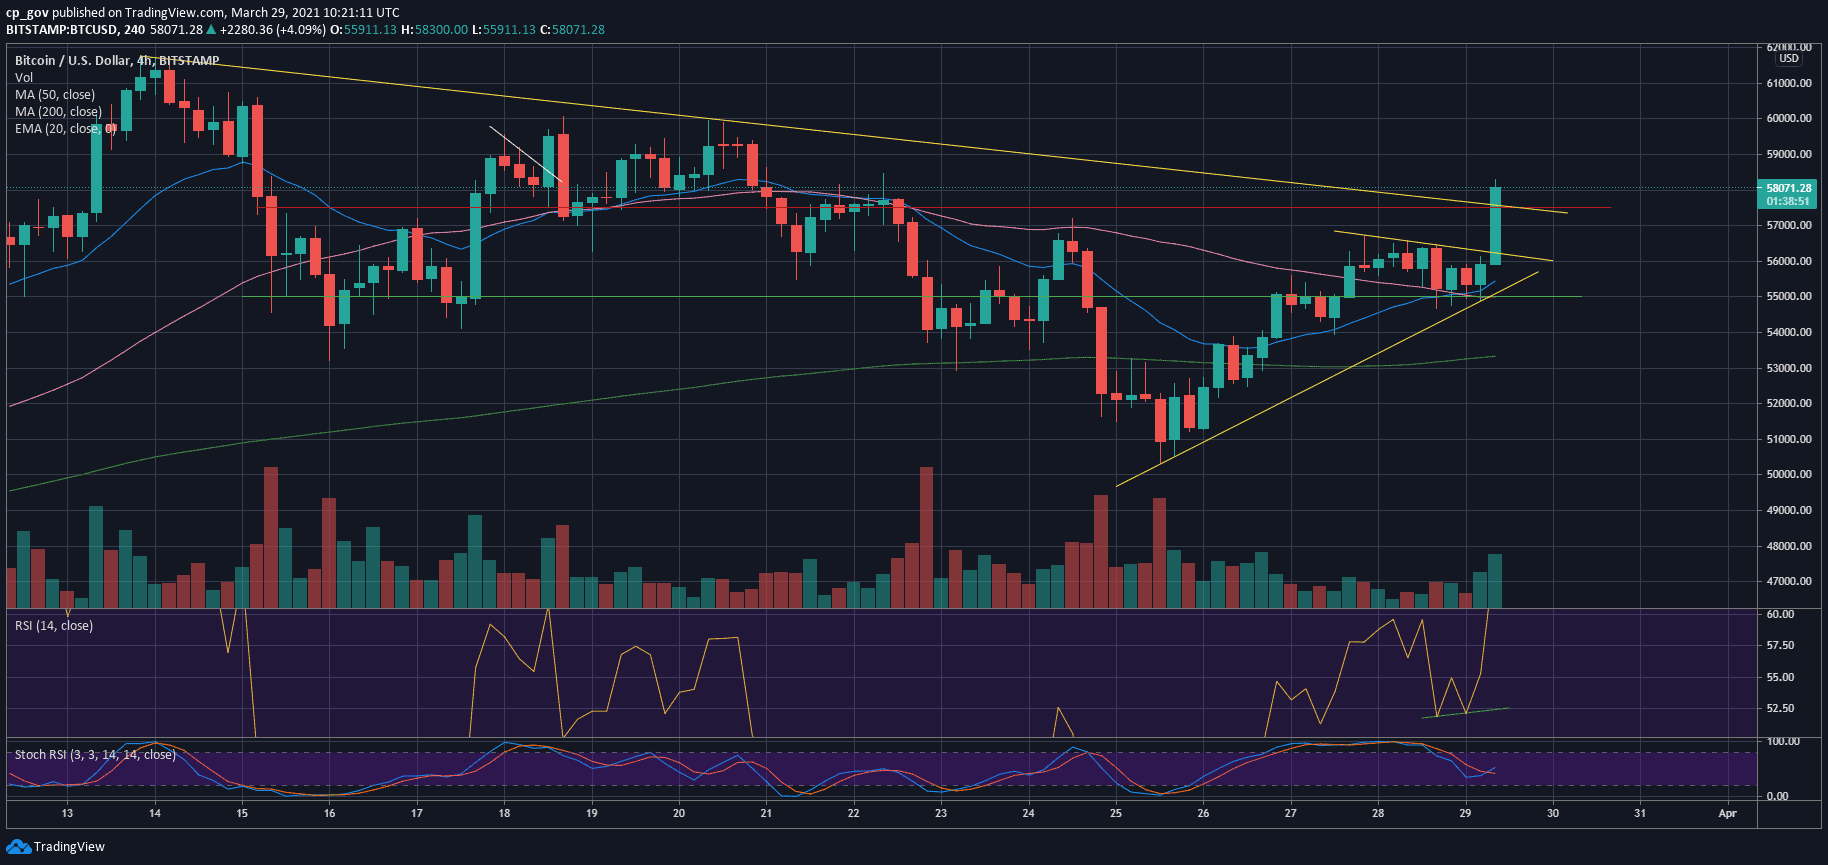
Today, a short while before writing up this update, Bitcoin saw a huge price increase, which allowed the cryptocurrency to break above the horizontal triangle formation, as shown on the following 4-hour chart. This happened as NASDAQ deep in red, which is a positive sign of impending decoupling.
As of now, the daily high is above $58k. Aside from a solid resistance (the previous February 21 ATH at $58,350), this is also a descending trend-line resistance on the daily chart below.
What’s Next For Bitcoin’s Short-Term?
As mentioned above, the first major level of resistance now lies at $58,000 – $58,350. This is followed by $60k, $60,800 before the current all-time high level recorded on March 13 at $61,780, according to Bitstamp.
From below, the first level of support now lies at $57.5K, followed by the 20-days MA (blue line) at around $56,500. Further down lies the yellow ascending trend-line (around $56k as of now) and $55k, before the 50-days MA, currently around $52.3K.
Looking at the RSI, the momentum indicator, we saw a bullish divergence on the 4-hour timeframe, which is another bullish sign for the short-term. As of now, the daily RSI trades well above the midline, indicating that the bulls are in control of the market.
BTC/USD 4-Hour Chart (Bitstamp)
BTC/USD Daily Chart (Bitstamp)