The month of April so far seems bullish for Bitcoin. After starting the month at around 00, the Bitcoin price quickly elevated to 00 (April 1st) and built a ‘baseline’ around this price zone.At the same time, 00 provided a tough resistance from the other side, and most of the time, Bitcoin was trading between the price range of 00 – 00, as we mentioned here before.As we can see, the 00 had been providing decent support for Bitcoin over the past week and could defend every attempt to break it. When the buying force is steady in holding that level, a breakout to the upside was a matter of time.And so, it did: As we can see on the following 4-hour chart, the 00 got finally broken, and from there, the way to the next resistance at 00 – 00 was a matter of time.It’s
Topics:
Yuval Gov considers the following as important: Bitcoin (BTC) Price, BTC Analysis, btcusd
This could be interesting, too:
Chayanika Deka writes XRP, SOL, and ADA Inclusion in US Crypto Reserve Pushes Traders on Edge
Chayanika Deka writes Why Arthur Hayes Is Bullish on Bitcoin Under Trump’s Economic Strategy
Mandy Williams writes Why the Bitcoin Market Is Stuck—and the Key Metric That Could Change It: CryptoQuant CEO
Wayne Jones writes Metaplanet Acquires 156 BTC, Bringing Total Holdings to 2,391
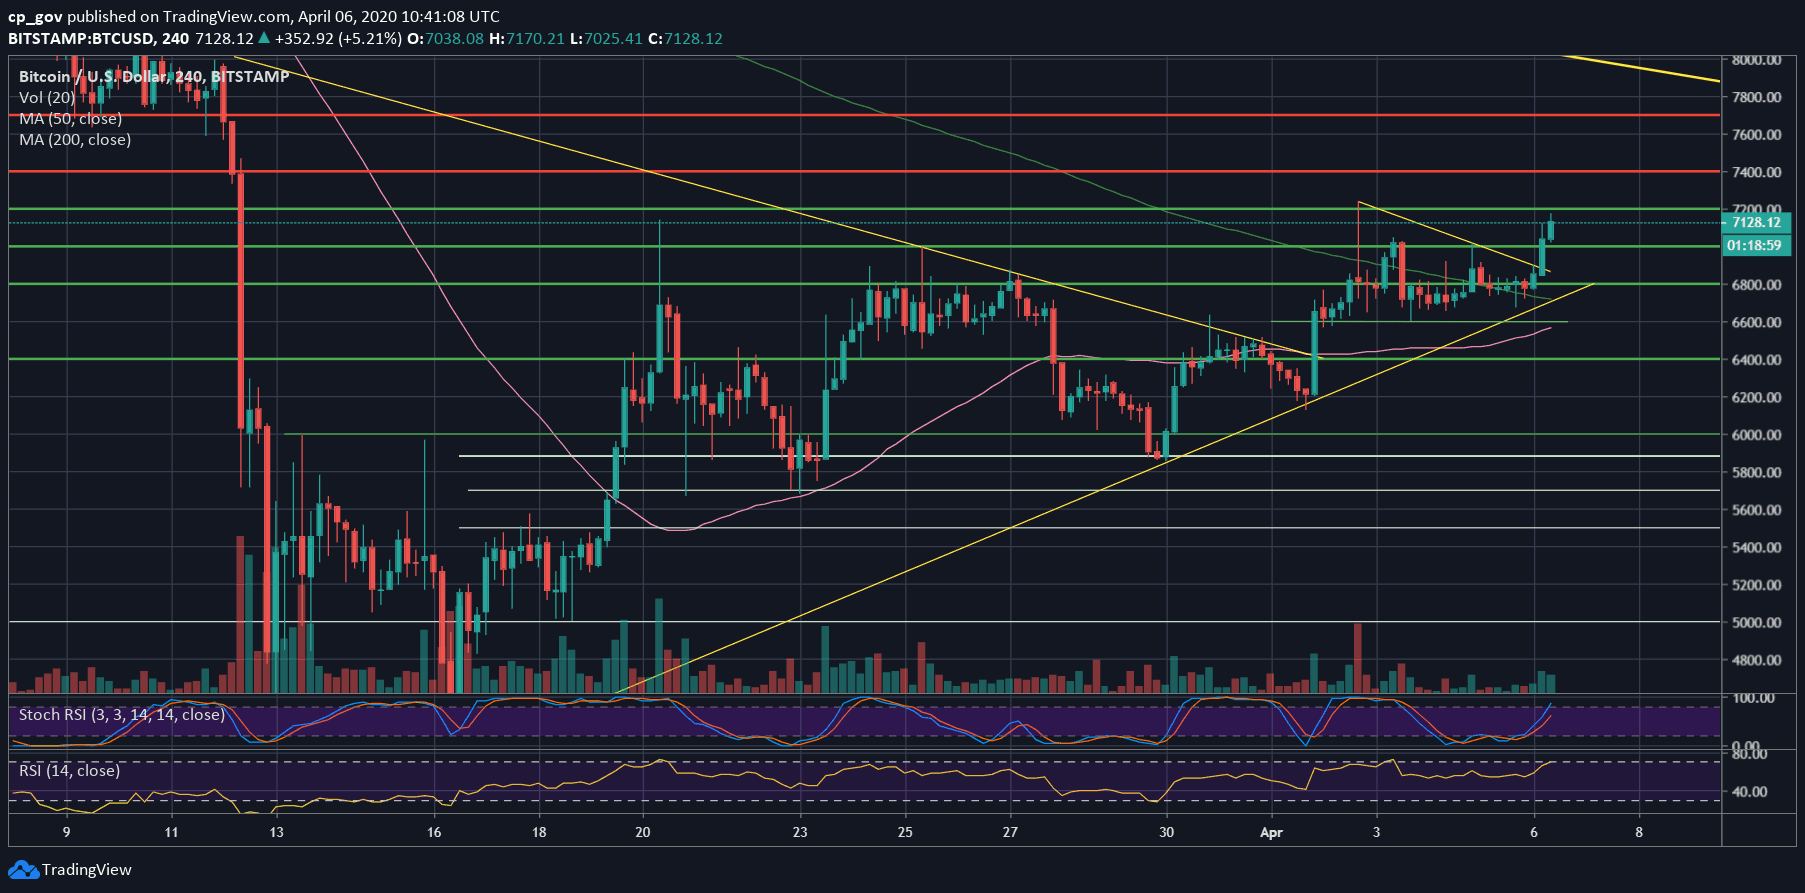
The month of April so far seems bullish for Bitcoin. After starting the month at around $6200, the Bitcoin price quickly elevated to $6600 (April 1st) and built a ‘baseline’ around this price zone.
At the same time, $6800 provided a tough resistance from the other side, and most of the time, Bitcoin was trading between the price range of $6600 – $6800, as we mentioned here before.
As we can see, the $6600 had been providing decent support for Bitcoin over the past week and could defend every attempt to break it. When the buying force is steady in holding that level, a breakout to the upside was a matter of time.
And so, it did: As we can see on the following 4-hour chart, the $6800 got finally broken, and from there, the way to the next resistance at $7100 – $7200 was a matter of time.
It’s worth mentioning that the latter price level, ~$7200, ended up being a ‘ceiling’ for the price of Bitcoin for three attempts over the past 2.5 weeks. Will this time be different? Only time will time; however, we can see some promising bullish signs.
Breakout Soon?
First, we must remember, the more times a resistance/support level is being tested, the higher the chance of breaking through it. Second, we can see that since the March 12 bottom ($3850, Bitstamp), Bitcoin is nicely building a higher-lows trajectory, which is a bullish formation.
One more reason is the daily RSI indicator. As can be seen, the RSI is trading at its highest level since mid-February, when Bitcoin was trading for 5-digits. The momentum indicator, the RSI, is at a higher level than the level of the 3-week high at $7236, which was reached on April 2nd. More than that, we can finally see that it is trading about the critical 50 RSI level.
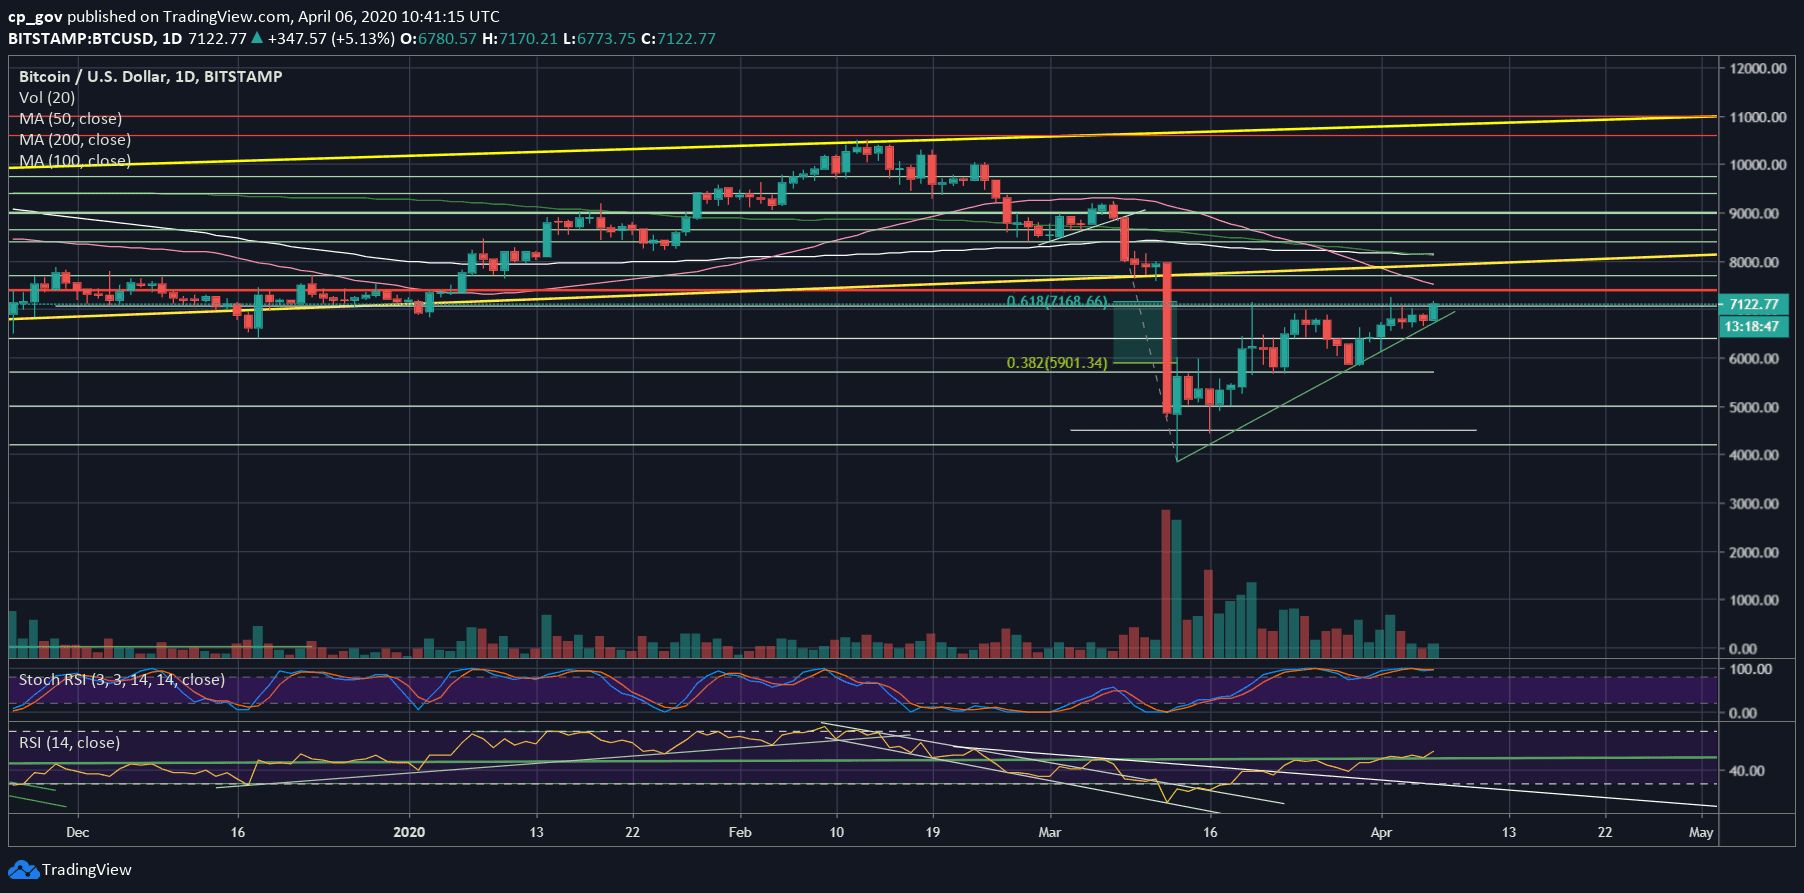
From the other side, the $7200 had been strong resistance for the past unsuccessful three attempts, and its mainly because it’s the Golden Fibonacci retracement level (61.8%) following the March 12 dump. Once this Fib level is broken above, we can cautiously say that the bottom is nailed.
Another thing to keep in mind is the global markets’ correlation. Bitcoin (and Gold) had been following Wall Street since this all COVID-19 chaos had begun. As of writing these lines, the futures on Wall Street are deep in the green.
Total Market Cap: $199.3 billion
Bitcoin Market Cap: $130 billion
BTC Dominance Index: 65.2%
*Data by CoinGecko
Key Levels To Watch & Next Possible Targets
– Support/Resistance levels: As mentioned above, Bitcoin is now facing the 3.5 weeks high at $7200, along with the 61.8% Golden Fib retracement.
In case of a break-up, we can expect the next price target to be around $7400, followed by the 50-days moving average line at $7500 (the pink line on the following 1-day chart), before reaching $7700. The last will mark a full recovery from the March 12 dump.
From below, the first levels of support now lie at $7000 and $6800. This is followed by $6600, which had been providing strong support for Bitcoin over the past week. Down below lies the $6300 – $6400 support zone.
– The RSI Indicator: discussed above.
– Trading volume: Despite the bullishness, the real volume is not here yet. Still far from the highs of March.
BTC/USD BitStamp 4-Hour Chart
BTC/USD BitStamp 1-Day Chart