So far, the new decade is in favor of Bitcoin’s Bulls. Following the break-out from two days ago, the price finally managed to get over the 00 – 00 resistance area, while setting a new 2-week high at 00 (Bitstamp), as of writing these lines.While the global stock markets are seeing heavy red, Bitcoin is enjoying the war talks between the US and Iran, following the death of General Soleimani by the US.As can be seen on the following 4-hour chart, over the past days Bitcoin had been paving its way up in the marked ascending channel. However, the real test of this channel will arrive when Bitcoin will reach the 00 – 00 price area.The last contains the 100-days moving average line (white), along with the most significant descending trend-line (started in June 2019, at the yearly
Topics:
Yuval Gov considers the following as important: Bitcoin (BTC) Price, BTCanalysis
This could be interesting, too:
Chayanika Deka writes XRP, SOL, and ADA Inclusion in US Crypto Reserve Pushes Traders on Edge
Chayanika Deka writes Why Arthur Hayes Is Bullish on Bitcoin Under Trump’s Economic Strategy
Mandy Williams writes Why the Bitcoin Market Is Stuck—and the Key Metric That Could Change It: CryptoQuant CEO
Jordan Lyanchev writes Liquidations Top 0M as Bitcoin Falls K, Reversing Trump-Driven Rally
So far, the new decade is in favor of Bitcoin’s Bulls. Following the break-out from two days ago, the price finally managed to get over the $7300 – $7400 resistance area, while setting a new 2-week high at $7600 (Bitstamp), as of writing these lines.
While the global stock markets are seeing heavy red, Bitcoin is enjoying the war talks between the US and Iran, following the death of General Soleimani by the US.
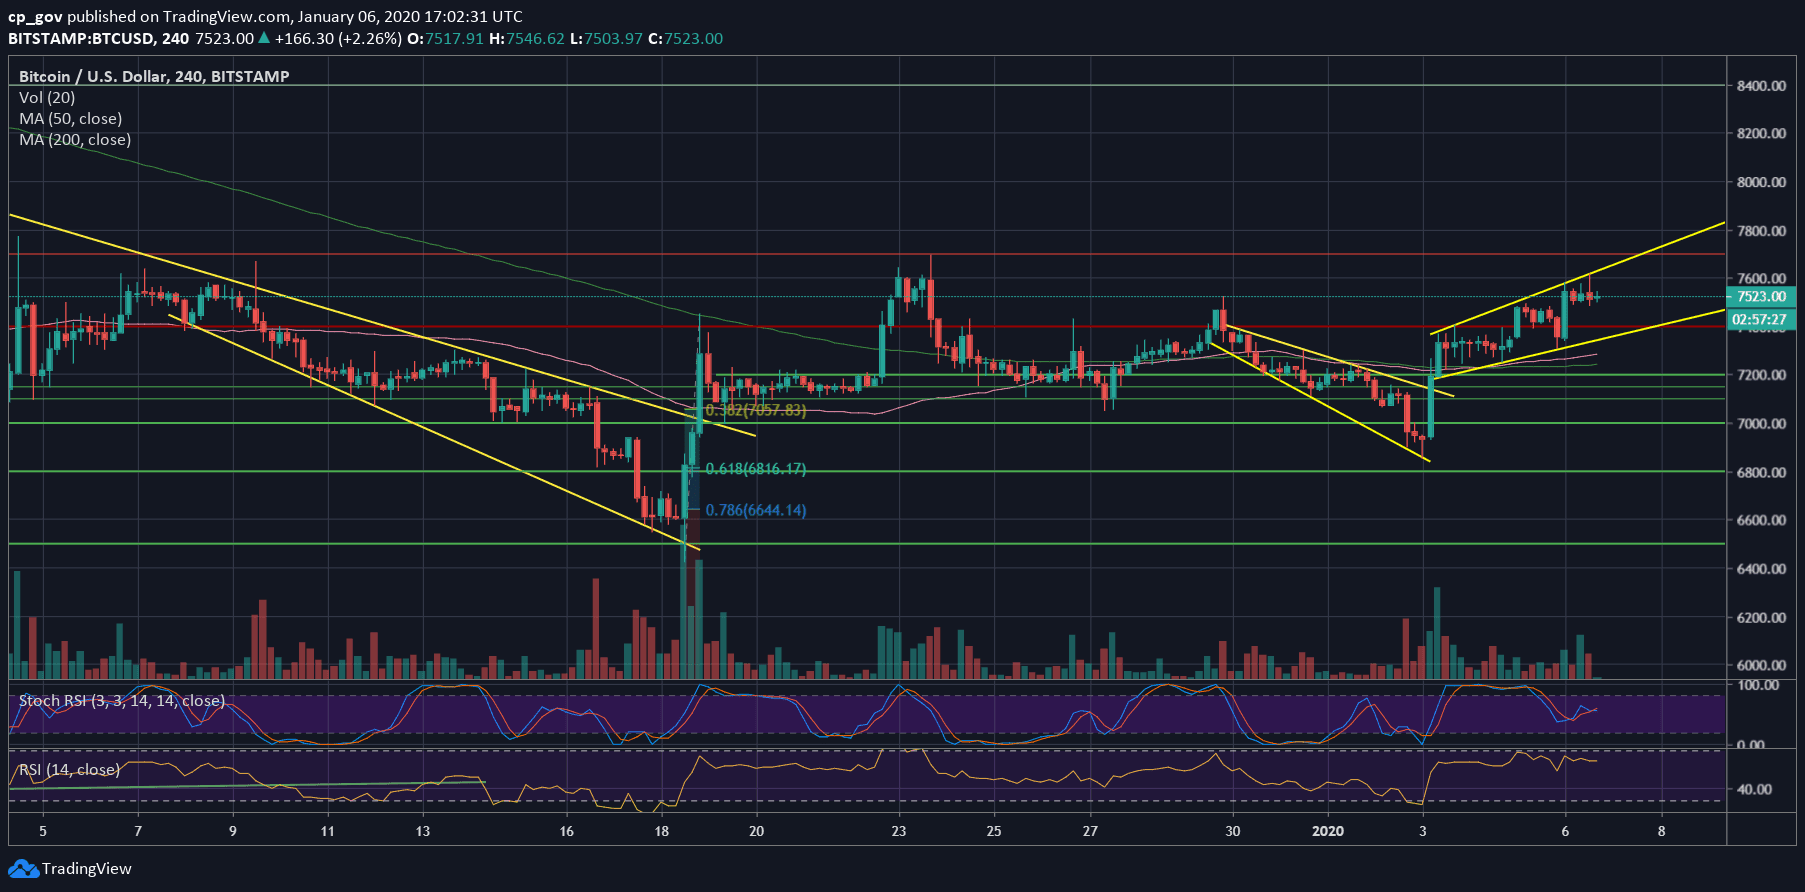
As can be seen on the following 4-hour chart, over the past days Bitcoin had been paving its way up in the marked ascending channel. However, the real test of this channel will arrive when Bitcoin will reach the $7700 – $8000 price area.
The last contains the 100-days moving average line (white), along with the most significant descending trend-line (started in June 2019, at the yearly high) and of course, the horizontal resistance lines of $7700 and $8000.
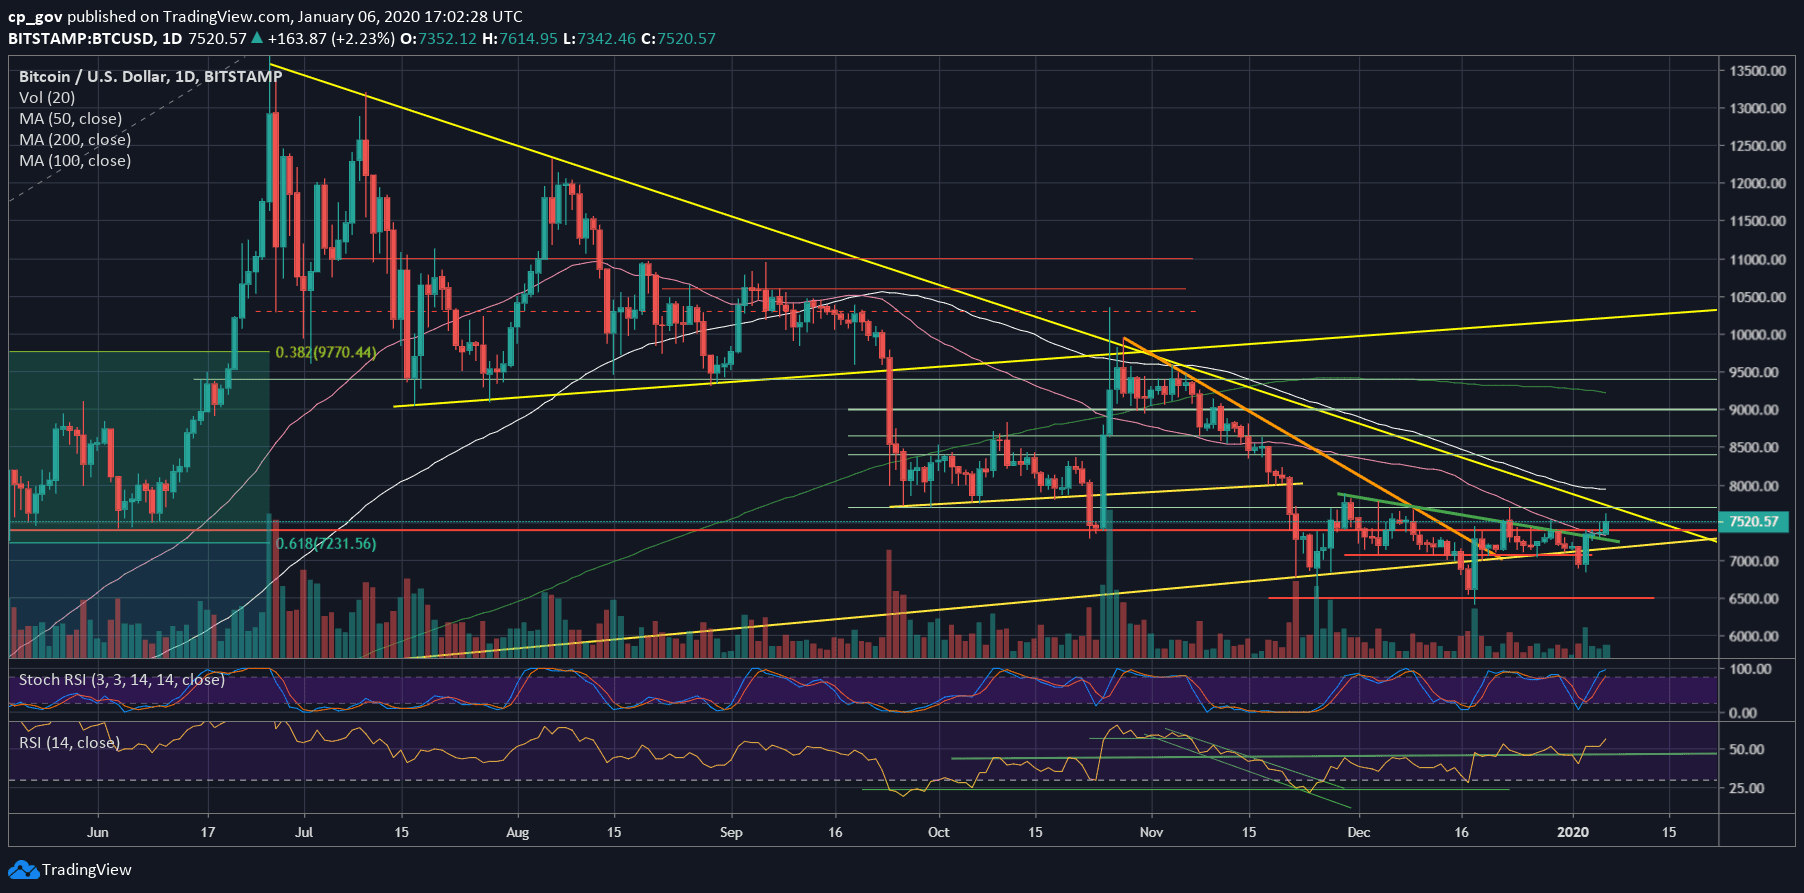
From below, the first support had now become the $7300 – $7400 area, along with the 50-days moving average line (marked pink). Further below lies $7200, along with the mid-term ascending trend-line on the daily chart. The next level is $7000 and $6800.
– The RSI Indicator: The momentum indicator wasn’t in this high of 56 for the past two months (!). This is a bullish sign and might indicate on a quiet accumulation of Bitcoin by the bulls.
– Trading volume: Despite the decent gains, the volume is not yet here. As mentioned in our previous analysis, January 3rd which ended as a reversal day, was followed by a decent amount of volume. However, heavy bag-holders are not here yet.
Total Market Cap: $203.6 billion
Bitcoin Market Cap: $137.6 billion
BTC Dominance Index: 67.6%
*Data by CoinGecko
BTC/USD BitStamp 4-Hour Chart
BTC/USD BitStamp 1-Day Chart