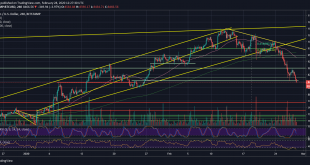
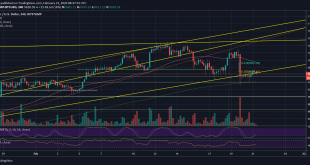
Just five days ago, Bitcoin was trading for more than $10,000 per coin. As the coronavirus fears hit the stock markets, Bitcoin is not left behind.The coin had completed $1000 drop in just three days, and over the past two days, Bitcoin had continued its decline towards the $8400 – $8500 horizontal support. The latter was mentioned here on the previous BTC price analysis from two days ago.Looking at the daily timeframe, we can see that Bitcoin was testing the $8770 – $8800 zone for the past...
Read More »Bitcoin Completes 3-Day $1000 Plunge: Where Is The Bottom? Price Analysis & Weekly Overview
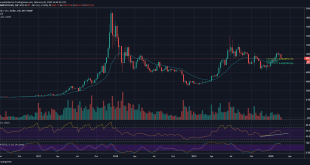
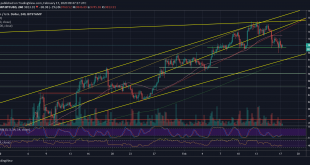
There is the endless argument about whether Bitcoin is a safe-haven asset like Gold. This could be true most of the time; however, Wall Street and the global markets are facing a difficult situation resulting in a fatal drop of almost 8% over the past four days, surrounding the coronavirus effects.And Bitcoin, this time, correlates accurately with the global markets. The primary cryptocurrency continues its drop from yesterday, and completes over a $1000 loss of value in the past three days....
Read More »Bitcoin Price Analysis: After $600 Plunge In 48 Hours, Bitcoin Is Facing Huge Critical Support Area
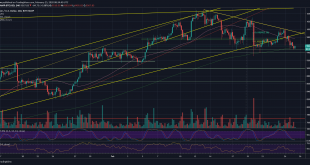
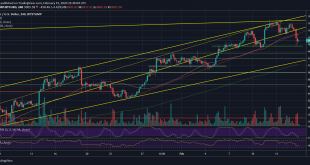
And the volatility continues: The past three weeks for Bitcoin’s price were very volatile. While the coin reached its new year’s high at $10,500, the fluctuations to both sides refuse to calm down over the past days.On our recent Bitcoin price analysis, we mentioned that Bitcoin was surging $300 intraday (towards the $10,000) and that this, in high chance, also could turn into a temp correction before discovering new lows.Unfortunately to the bulls, and following the massive global markets...
Read More »Bitcoin Price Analysis: Following Decent $300 Surge – Is Bitcoin Ready To Conquer $10,000 Again, Or Just A Temp Correction?
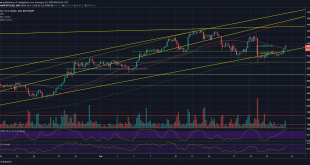
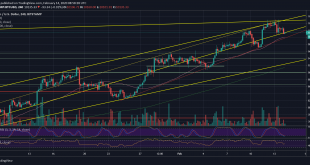
Following the huge price dump last Wednesday, we saw Bitcoin trading in the tight range between $9550 and $9750 until a few hours ago, where the primary cryptocurrency had decided to fire some engines towards a critical resistance level.As of writing these lines, Bitcoin is testing the $9900 – $10,000 resistance. As mentioned in our previous analysis, the $9900 horizontal resistance is also the Golden Fib retracement level (61.8%, lies at $9922). As can be seen on the following daily chart,...
Read More »Bitcoin Price Analysis: Following The Huge Dump, Can Bitcoin Recover Before Plunging To $9000?
Bitcoin, just like Bitcoin, is sometimes having wild moves that are unexpected. As we mentioned in our recent price analysis, the last week was very volatile and abnormal for BTC.After breaking the bullish uptrend, followed by 38.2% corrections, we started to witness the abnormal behavior: Bitcoin dropped down almost to $9400 before a pump to $10,300, which had quickly turned into a classic Bull-trap.On the lower timeframe – the 4-hour chart, we can see Bitcoin forming a double-top (which is...
Read More »Bitcoin Price Analysis: Following Huge $700 24-HR Increase, Is Bitcoin Planning For a New 2020 High Soon?
A quick recap of the recent price action: Following a bloody weekend after rejecting from the $10500 resistance level, the current 2020 high, Bitcoin had dropped to its weekly low at $9467 (Bitstamp).This is not a coincidence, BTC had accurately reached our marked lower descending trend-line that follows Bitcoin’s price action since January 3rd, on the following 4-hour chart.As we stated here before, since 2020 begun, we see a bullish higher-low trajectory. And yes, corrections are a healthy...
Read More »Bitcoin Price Analysis: Despite The Correction, BTC’s Showing Strength But Still In Danger. $9000 Or $10K Next?
Following our recent price analysis, we saw Bitcoin starting to go lower for a deeper correction. At least lower than the usual 38.2% Fib level correction we had seen three times before since the magnificent 2020 begun.After Bitcoin was testing the long-term ascending trend-line at $10,500 – a trend-line which had started forming in July 2019 – we saw Bitcoin getting rejected severely, breaking down the 38.2% Fib level at $10,200.On our recent price analysis, we expected Bitcoin to go even...
Read More »Bitcoin Price Analysis: BTC Drops $700 Intraday, Back Below $10K – Time For Bears’ Action?
Just a quick weekend recap: Following our most recent BTC price analysis from Friday, where we had stated that the correction is likely to test lower levels, we can see Bitcoin breaking below $10,000 after failing to break above the crucial resistance at $10,500.As can be seen on the following daily chart, after getting rejected by the long-term ascending trend-line (started forming on July 2019), Bitcoin broke down the significant 38.2% Fib level at $10,200, along with the marked 4-hour...
Read More »Bitcoin Failed To Break The Crucial 2019 Resistance Line: How Low Can It Drop From Here? BTC Price Analysis & Overview
Two days ago, on our most recent BTC price analysis, we had mentioned that Bitcoin is reaching for a crucial long-term resistance line from 2019, we had also mentioned a bearish price divergence on the daily RSI.This resistance is the ascending trend-line marked on the following daily chart, which had started forming in July 2019. The line falls precisely on the $10,500 mark. Yes, this is the high of yesterday and the current high of 2020.After touching $10,500 for the third time in 48...
Read More »Bitcoin Price Analysis: BTC Skyrockets $800 To New 5-Month High, Now Facing Critical Resistance From 2019
This is going to be a quick update following our latest Bitcoin price analysis from yesterday.As mentioned yesterday, since the year of 2020 begun, Bitcoin price had gone through three mini-rallies. All those rallies corrected back to the Fibonacci retracement level of 38.2% (a clear sign of bullish uptrend).The last of the three rallies ended yesterday, while Bitcoin corrected to $9,750 (which is the 38.2% Fib level).We stated in our analysis that in the case Bitcoin maintains that level –...
Read More » Crypto EcoBlog

