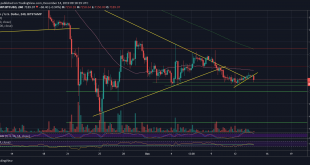
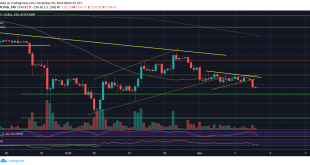
The BTC consolidation continues: for the past four days, Bitcoin’s price range had been shrunk to $150 only. From above $7300, from below $7150. This is coming after almost two weeks, since December began, of nearly zero volatility.The only people who benefit from such a market are those who run crypto margin exchanges. However, they can’t be that happy since the trading volume is also declining.Following price consolidation, declining volume, and on top – Bollinger Bands, which are very...
Read More »Bitcoin Price Analysis: $7000 Target Accomplished, But Things Can Get Very Ugly From Here
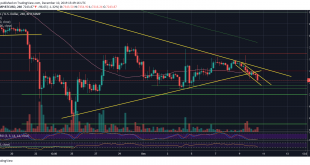
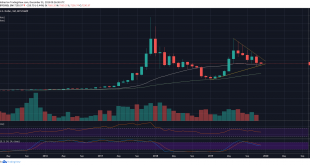
We are almost over half of December, but so far, the last month of the year is very disappointing the Bitcoin traders.Despite the bearish signs that Bitcoin is showing, the trading action is dull, followed by a relatively low amount of trading volume. Things are progressing very slowly.In matters of the price, yes, we are at $7000 after we stated here just two days ago that Bitcoin is heading to re-test the $7,000 price area.Low Volume Huge ManipulationsBecause of the low amount of volume,...
Read More »Bitcoin Price Analysis: BTC Is Locked Inside a Bearish Descending Channel, $7000 Next Target?
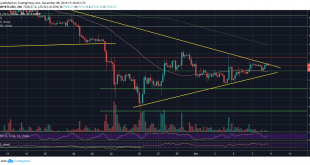
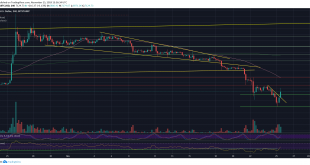
Our previous price analysis had identified a tight range in which Bitcoin is trading inside. Over the past hours, this range is seemingly cracking down, to the downside.For the past five days, Bitcoin was trading between $7300 to $7600. Despite a fake-out that reached the mentioned resistance area of $7700, Bitcoin was trading inside a descending channel, which can be seen on the following 4-hour chart.Adding negative indication coming on behalf of the Relative Strength Index (the RSI), as of...
Read More »As New Week Starts, Bitcoin Price Is About To Take a Critical Decision (BTC Analysis & Overview)
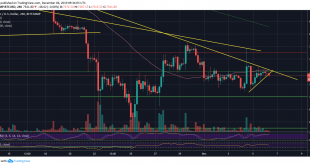
The last days saw Bitcoin trading under a tight range of $300, between $7300 and $7600.The good news is that Bitcoin is finally trading above the confluence zone of $7300 – $7400, along with the 4-hour MA-50, which was mentioned here more than once.Besides, the RSI is showing strength due to the negative divergence shown on both the following charts.However, Bitcoin is now facing a critical decision as the coin reaching a mid-term descending trend-line. This can be seen on both the following...
Read More »Bitcoin Price Analysis: BTC to $6000 Or $8000? Bulls Vs. Bears War Continues
In our recent price analysis, we had anticipated a huge move coming up very soon. We couldn’t predict to which direction.The result was a massive $800 move to the upside, followed by an opposite move to the downside, to exactly where the movement began from (roughly $7100). And the winner is? Of course, the exchanges that allow margin trading, who encourage trading volumes.The bottom line is that Bitcoin stays at the same price level, the same confluence price zone, between $7300 – $7400,...
Read More »Bitcoin Price Breaks Down Towards $7000: The Indicators Anticipating a Huge Move Coming-up
Over the past three days, Bitcoin was ‘stuck’ between the significant price range of $7300 – $7400. This range is familiar to Bitcoin, as the cryptocurrency struggled there for an extended period during November.The last time Bitcoin broke down from that range; it resulted in a daily candlewick down to $6500, which is the lowest price of Bitcoin since May 17, 2019.Besides, on the daily chart, Bitcoin encountered two major descending trend-lines and couldn’t overcome beyond them.A few hours...
Read More »Bitcoin Price Analysis: November’s Candle Ended Very Bearish, What Does It Mean For December?
From euphoria to depression: The recent volatility in the price of Bitcoin had burned many shorts and longs. Heaven for traders, hard times for the HODLers.On Friday, just two days ago, everyone was bullish, following a breakout of a decent inverse head and shoulders pattern (at $7400). Following our recent analysis, the huge bullish move had indeed arrived, but couldn’t resist beyond $7870.Then, Bitcoin encountered a long-term descending trend-line, shown both on the following 4-hour and the...
Read More »Bitcoin Price Analysis: BTC’s Consolidation To End-Up In a Huge Weekend Move?
It took just a few hours after we posted our previous Bitcoin price analysis, and Bitcoin broke out nicely the $7400 resistance, which is the neckline of the inverse head and shoulders pattern.Since then, Bitcoin quickly made a move to our next mentioned resistance level of $7700 and quickly got rejected. Over the past 40 hours, Bitcoin is trading under the tight range of $7400 to $7700.From the bullish side, after such a massive move ($6800 to $7700), a correction or consolidation was...
Read More »Bitcoin Price Could Soon Reach $8300, According To This Inverse Head & Shoulders Pattern (Analysis & Overview)
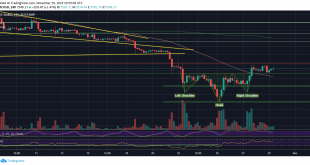
Over the past two days, the volatility surrounding the price of Bitcoin had calmed down a bit.Despite a little glitch to the downside, Bitcoin (BTC) is trading between $7000 and $7400 over the past 48 hours.The good news could be the formation of an inverse head and shoulders pattern, that if played out, can grant Bitcoin a decent short-term target around $8300.The pattern can be clearly seen on the following 4-hour chart, and it will play out in the case of a breakout of the $7400 neckline...
Read More »Did Bitcoin Price Find a Bottom? BTC Is Back Above $7K Following $700 Daily Gains (Analysis & Overview)
The past week was one of the worst for Bitcoin. The coin’s price had seen a $2000 decline over the past seven days.This morning Bitcoin recorded another new low since May 17 – at $6513 (Bitstamp). However, the cryptocurrency didn’t spend much time at those price levels, and over the past hours, we are witnessing a decent comeback in green:As of writing this, Bitcoin is trading $700 above the daily low, whereas the current daily high almost touches $7300 (~$800 intra-day price increase).The...
Read More » Crypto EcoBlog

