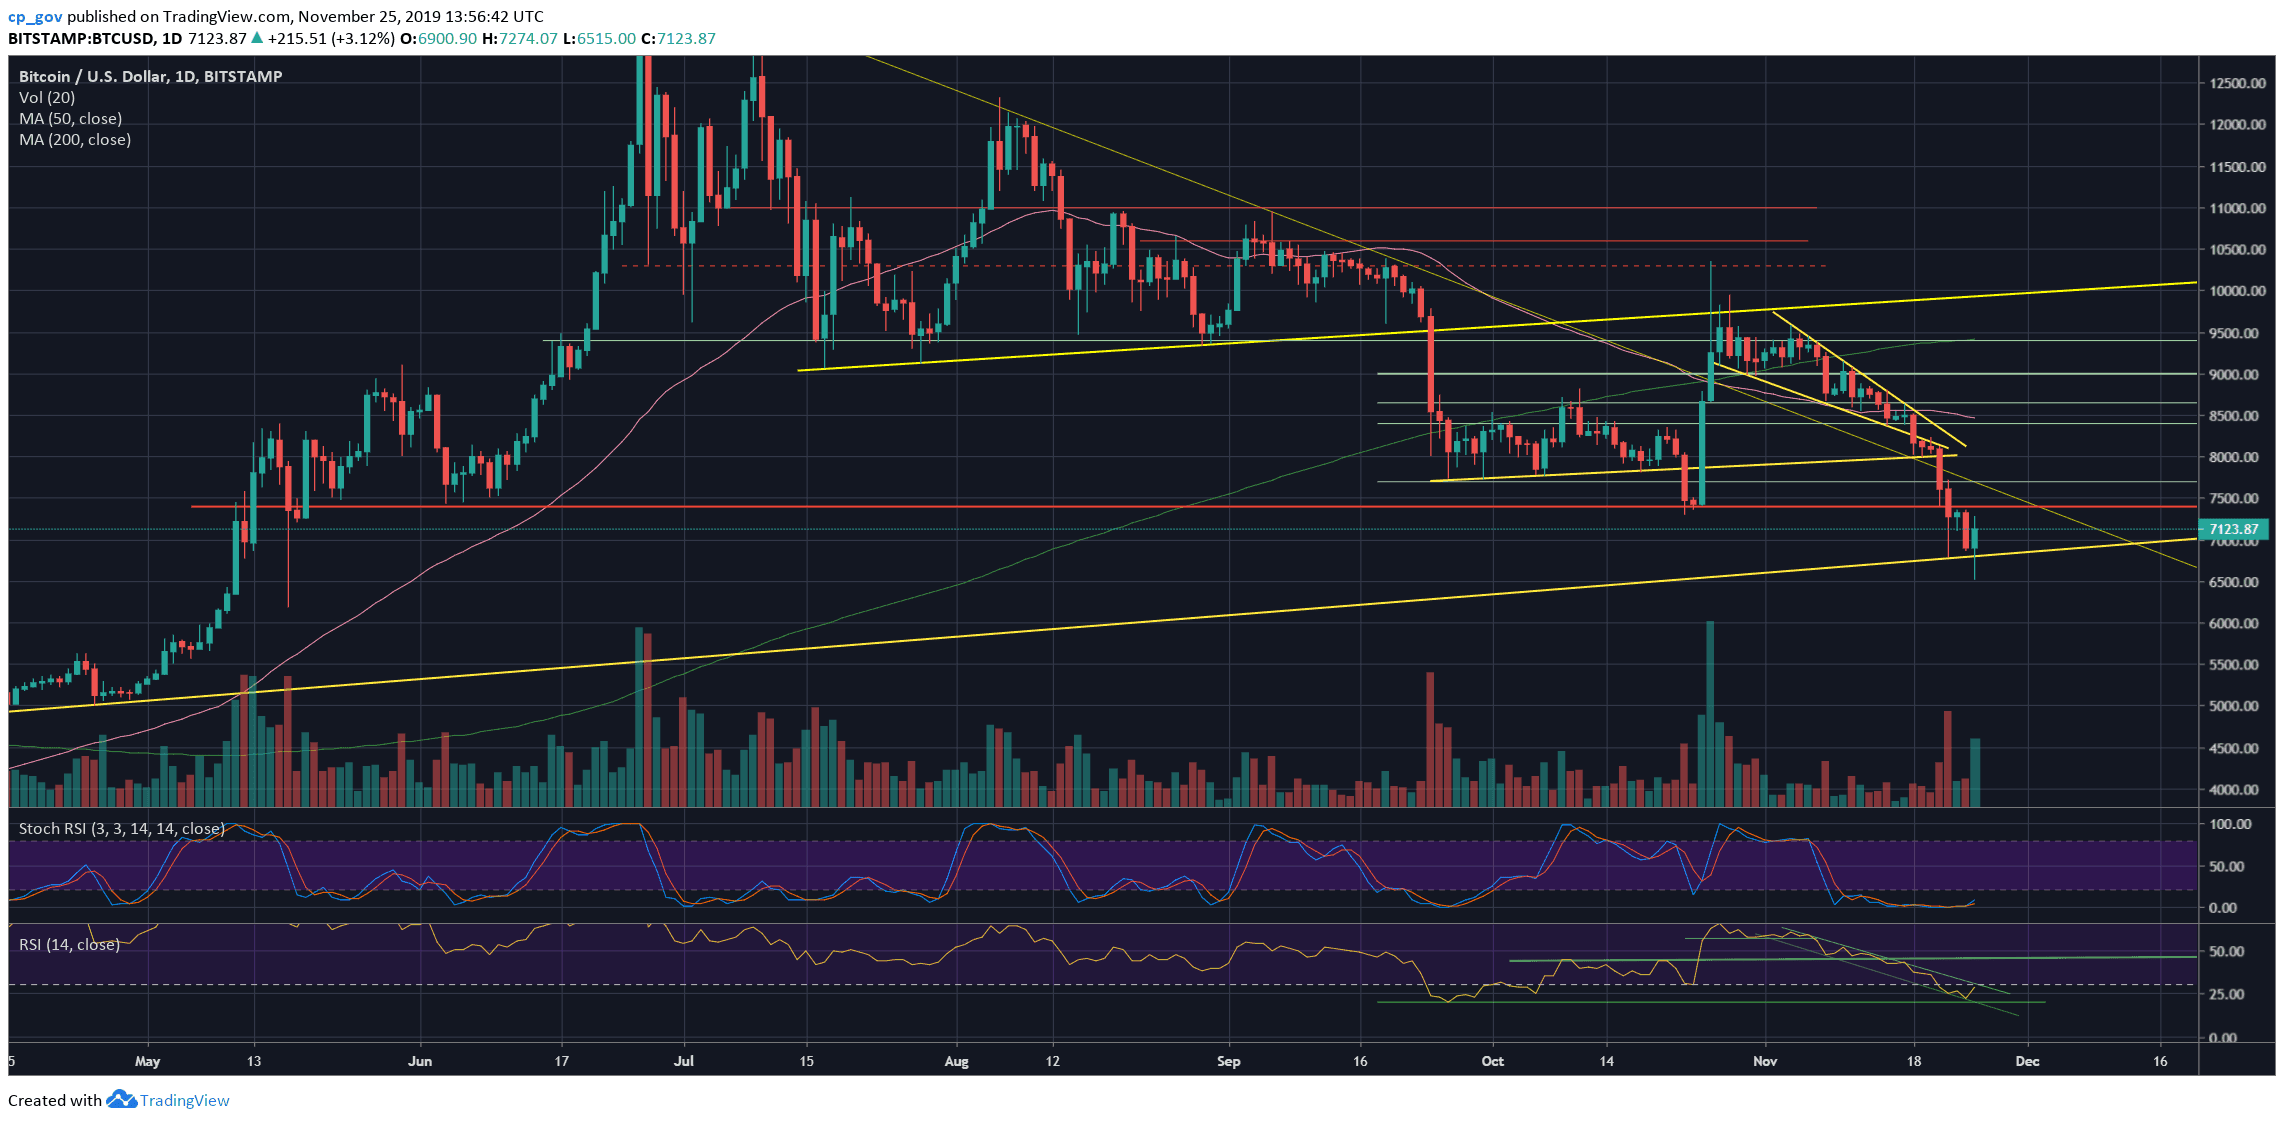
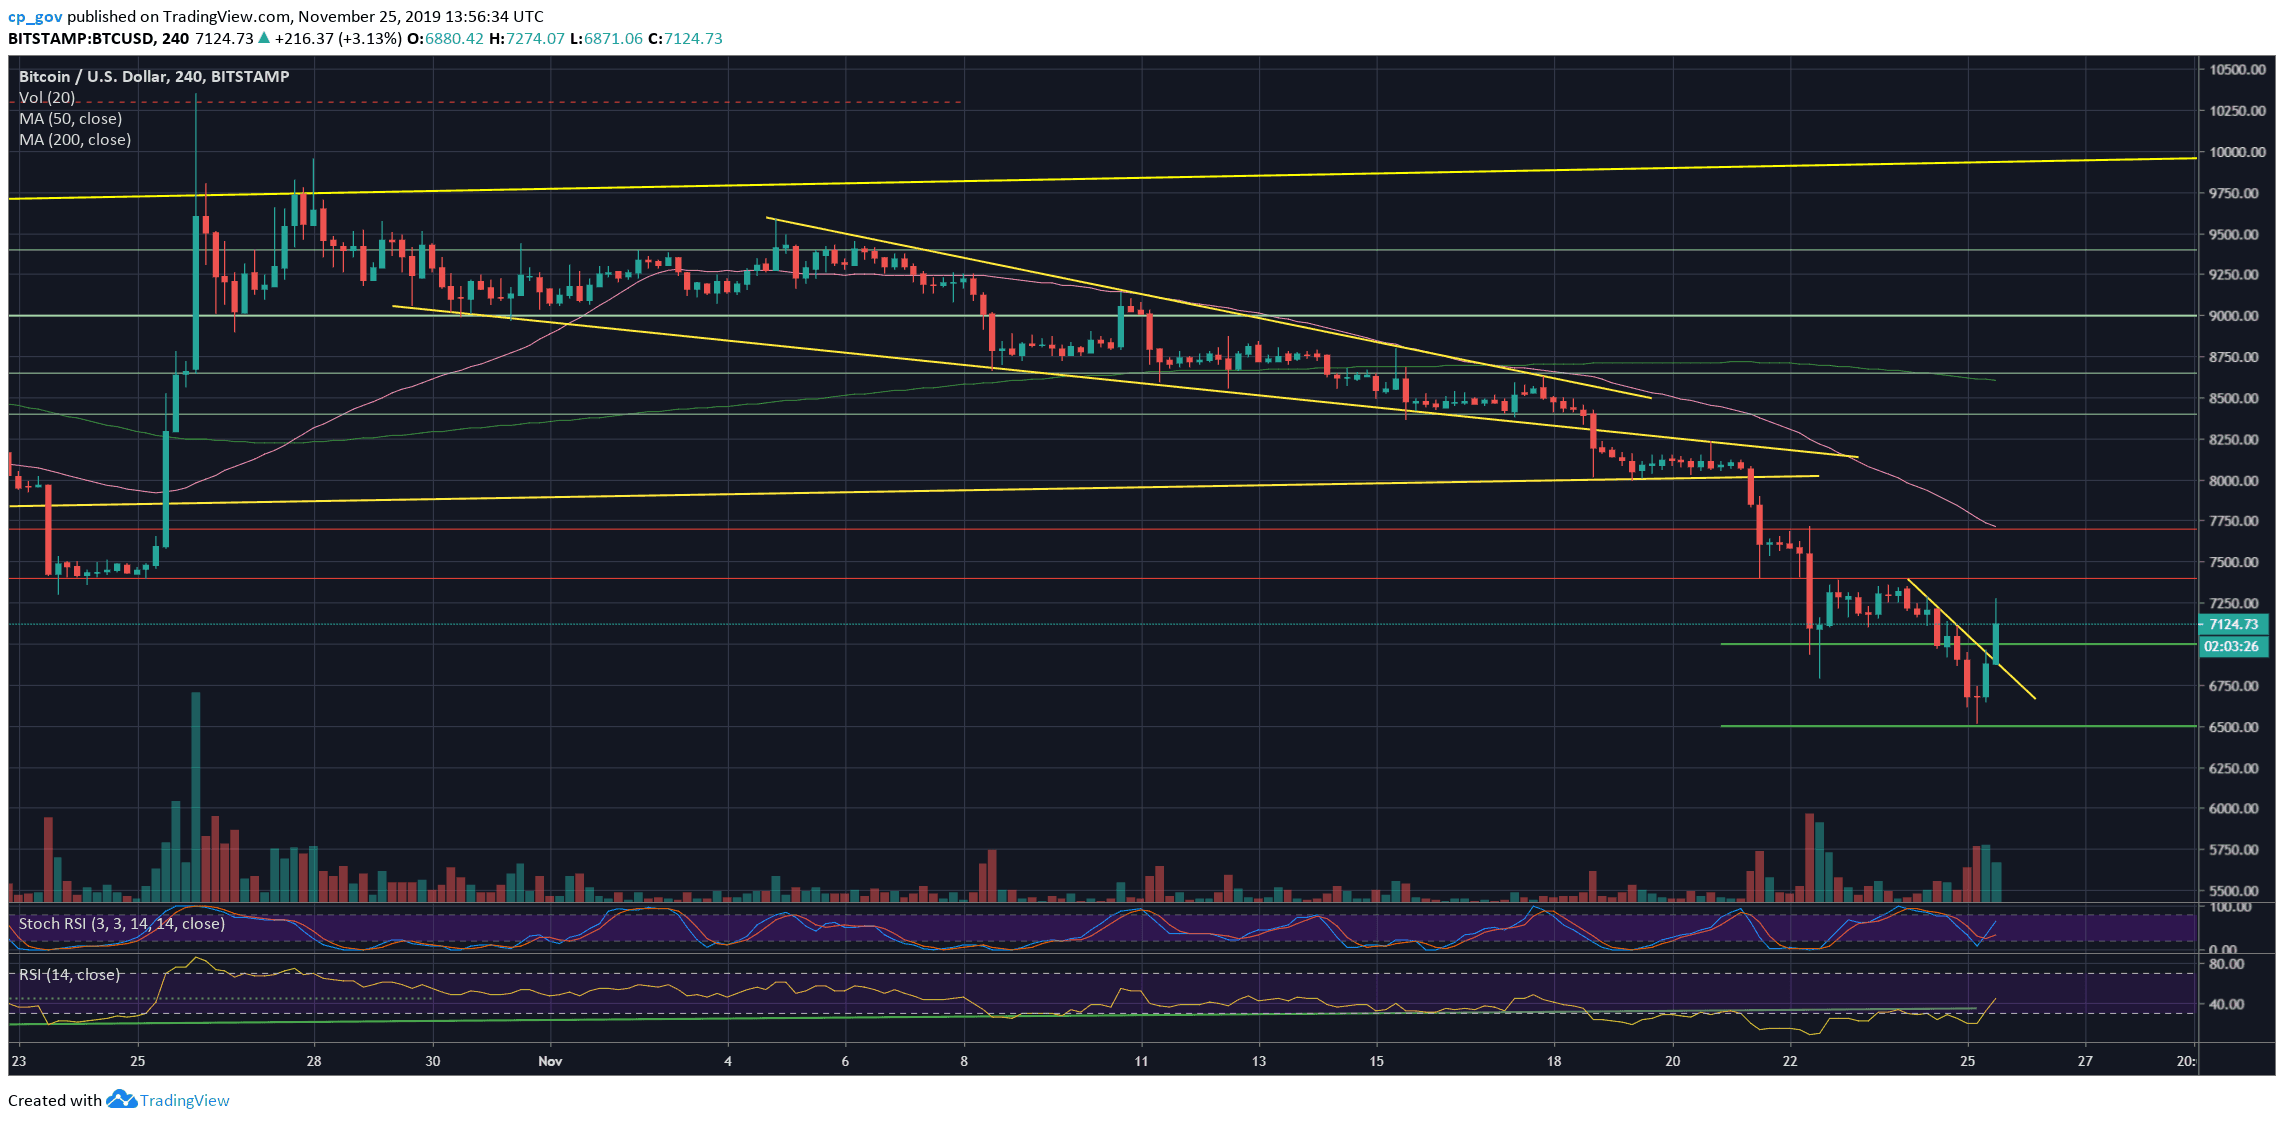
The past week was one of the worst for Bitcoin. The coin’s price had seen a 00 decline over the past seven days.This morning Bitcoin recorded another new low since May 17 – at 13 (Bitstamp). However, the cryptocurrency didn’t spend much time at those price levels, and over the past hours, we are witnessing a decent comeback in green:As of writing this, Bitcoin is trading 0 above the daily low, whereas the current daily high almost touches 00 (~0 intra-day price increase).The positive outcome could be a Hammer candle on the daily chart, which is known a bullish reversal pattern. Of course, there is still enough time till the daily candle close, but so far, it looks promising.Added to the above, we had mentioned the significance of the mid-term ascending trend-line, which was
Topics:
Yuval Gov considers the following as important: Bitcoin Prediction, bitcoin price, BTC, BTCanalysis
This could be interesting, too:
Christian Mäder writes Bitcoin-Transaktionsgebühren auf historischem Tief: Warum jetzt der beste Zeitpunkt für günstige Überweisungen ist
Christian Mäder writes Das Bitcoin-Reserve-Rennen der US-Bundesstaaten: Wer gewinnt das Krypto-Wettrüsten?
Emily John writes Metaplanet Expands Bitcoin Holdings with .4M BTC Purchase
Christian Mäder writes Die besten Bitcoin-Visualisierungen: Ein Blick auf Preisentwicklung, Blockchain und Netzwerk
The past week was one of the worst for Bitcoin. The coin’s price had seen a $2000 decline over the past seven days.
This morning Bitcoin recorded another new low since May 17 – at $6513 (Bitstamp). However, the cryptocurrency didn’t spend much time at those price levels, and over the past hours, we are witnessing a decent comeback in green:
As of writing this, Bitcoin is trading $700 above the daily low, whereas the current daily high almost touches $7300 (~$800 intra-day price increase).
The positive outcome could be a Hammer candle on the daily chart, which is known a bullish reversal pattern. Of course, there is still enough time till the daily candle close, but so far, it looks promising.
Added to the above, we had mentioned the significance of the mid-term ascending trend-line, which was started forming in April this year. As of writing this, the candle’s body is safely above it. Actually, any daily close above $6800 will be considered bullish for Bitcoin and might signal a temporary end to the past week’s severe declines.
Total Market Cap: $195.6 billion
Bitcoin Market Cap: $129.8 billion
BTC Dominance Index: 66.4%
*Data by CoinGecko
Key Levels to Watch
– Support/Resistance: Following the recent gains, Bitcoin is now facing the significant $7300 – $7400 resistance area, which was a clear boundary for Bitcoin over the past three days. In case of a break-up, the next resistance lies at $7700. In order for Bitcoin to return to the bullish track, it will need to at least get over the $8000 benchmark and confirm it as support by creating a higher-low.
From below, $7000 had become the first resistance turned support level. In case Bitcoin goes lower, then $6800 is the next support level, along with the significant ascending trend-line (as mentioned above). Further below is $6500, which is the daily low. Further down lies $6000 – $6200, that should serve as a strong demand zone.
– The RSI Indicator: After falling from 25, the RSI found support around 20, which is the lowest RSI level since November 2018. As can be seen on the following chart, the RSI is facing resistance around the 30 level, along with a descending trend-line (marked). This can stop the party for a while.
The stochastic RSI oscillator finally produced a bullish cross-over at the oversold territory. However, the oscillator hadn’t entered the neutral territory so far.
– Trading volume: Friday ended up with the highest volume since October 26, Saturday, and Sunday saw a minor amount of volume – may be because of the weekend. If the bulls plan on a reversal, then today’s volume candle better closes with a high amount of volume.
BTC/USD BitStamp 4-Hour Chart
BTC/USD BitStamp 1-Day Chart