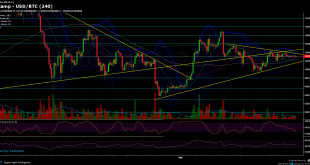
Over the past three days, and since our previous price analysis, we had seen Bitcoin almost steady, waving between $10,200 to $10,400.A triple-day turnover of only about $200 (roughly 2%) is rare in the recent Bitcoin’s history. Looking at the Bollinger Bands (marked with blue on the following 4-hour chart), they are at their closest level since September 1st. When This kind of setting takes place, it indicates that a sharp price move is likely coming up. In the last time the bands shrunk...
Read More »Bitcoin Price Analysis: Another Attempt To Break The Crucial Resistance Line – Will This End-Up In $11,000 Or $9,000 For BTC?
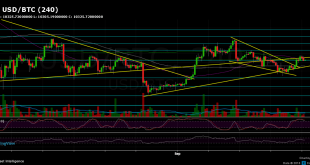
Two days ago, while Bitcoin was attempting to stay above the critical $10,000 mark, we have pointed out two scenarios in the bigger picture:“The bigger picture from below is the crucial support line around $9,400, which is the last barrier before the triangle breaks to the downside. From the top, the triangles’ trend-line sits around the resistance level of $10,300 – $10,400.”, as taken from the previous Bitcoin price analysis.As you could see, the wedge shown on the 4-hour chart had been...
Read More »Bitcoin Struggles To Maintain $10,000: The Last Time Bitcoin Sees 5-digit Price In September 2019? BTC Price Analysis
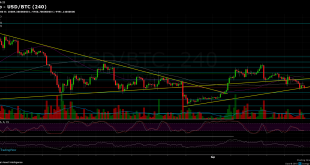
As you probably know, technical analysis is not always right, but it’s correct most of the time. Three days ago while Bitcoin was trading around $10,600, our last analysis title suggested another re-test of the $10,000 level, when everyone was bullish, we saw this leg down coming-up.As you could notice, after getting rejected one more time by the crucial long-term descending yellow trend-line, started forming from the 2019 high at $13,880, Bitcoin plunged passed $10,000, marking the $9,880...
Read More »Bitcoin Price Analysis: Can This 4-Hour Bear Flag Send Bitcoin Down To Re-Test $10,000?
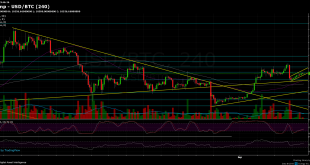
In the last analysis, we had mentioned the crucial descending trend-line, marked with yellow on the following daily chart. This line is ‘preventing’ Bitcoin from discovering new highs since June 26, when Bitcoin reached $13,880 as the 2019 high.The resisting line was tested for the fourth time, and as it seemed like a breakout is knocking, it turned to be a false one – producing a decent red candle on the daily, with a wick above the line. The hit was hard: Bitcoin plunged $700 in a matter of...
Read More » Crypto EcoBlog


