Yuval Gov
October 10, 2019
Bitcoin (BTC), Crypto news, Markets
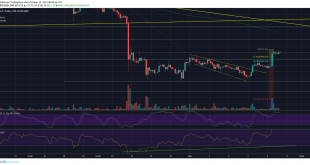
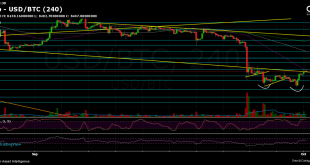
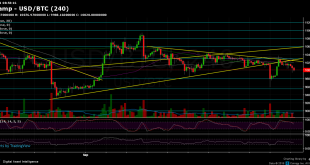
The bullish divergence mentioned in yesterday’s analysis, along with the descending wedge’s breakout three days ago, is so far not disappointing for the price of Bitcoin. Shortly after yesterday’s update was released, Bitcoin surged $400 exactly to our marked resistance of the MA-200.Many traders consider the 200-days moving average line, which is marked in light green on the following BTC daily chart, as the distinguish between Bull and Bear markets. Since September 26, Bitcoin was trading...
Read More »
Yuval Gov
October 9, 2019
Crypto news, Markets
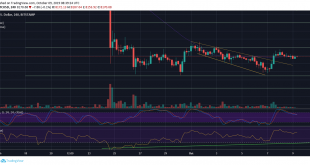
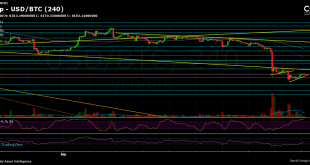
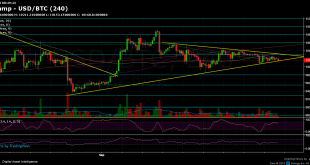
Two days ago, following our bullish divergence pointed out on our previous Bitcoin price analysis, we saw Bitcoin’s massive and impressive $600 move from the September low at $7700 to near the top of the short-term price range ($8400).Since then, the coin had corrected back to its currently trading price area of $8200.On the following daily chart, we can identify the past 14-days tight range of sideways action between $7700 and $8400. Being said that, Bitcoin should come to a decision soon....
Read More »
Yuval Gov
October 6, 2019
Bitcoin (BTC), Crypto news, Markets
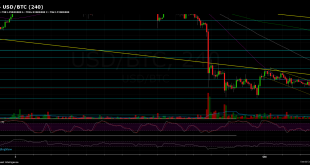
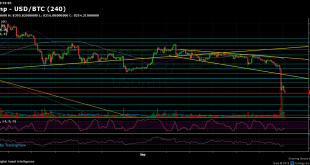
The past days had been boring for the crypto traders, whereas the price of
Bitcoin is ‘stuck’ between a tight range of $8,000 to $8,400.However, Bitcoin just plunged below $8K one more time, marking $7920 as the current daily low (Bitstamp). What does it
mean? Is Bitcoin finally leaving the significant $8K support area searching for
new lows?By looking at the declining daily volume candles, together with the steady but stable recent
Bitcoin price action, we can assume that a stronger move...
Read More »
Yuval Gov
October 3, 2019
Bitcoin (BTC), Crypto news, Markets
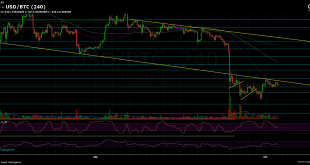
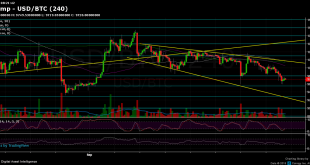
September was a tough month for Bitcoin. The famous cryptocurrency reached a high of nearly $11K before the end of the month’ plunge down to $7,700. Over the past days, the first days of October, we saw Bitcoin price trying to recover in a continues consolidation between the marked descending trend-line on the following 4-hour chart and $8,200 from below.This seems like another mini bearish triangle. These kinds of formations tend to breakdown; however, there’s always the possibility to...
Read More »
Yuval Gov
October 1, 2019
Bitcoin (BTC), Crypto news, Markets
After the bulls had been lately suffering, seeing Bitcoin plunging to $7,700, we started to see an opportunity for a price pull-back on our recent price analysis, three days ago.Following a decent daily move of $700 since reaching yesterday’s low, the question is, if that indeed was the real bottom. In short, we could identify a double-bottom formation which is bullish and can support the idea of bottoming.However, to confirm that, Bitcoin will have to show some more bullish evidence. As of...
Read More »
Yuval Gov
September 28, 2019
Bitcoin (BTC), Crypto news, Markets
After creating another leg down that marked another new low since this bear move started, Bitcoin showing signs of recovery.Despite the above, Bitcoin is currently getting close to its real major test, which is the 200-days moving average line (marked light green on the following daily chart). That line is considered, by many, the ultimate barometer of the market.If the price is traded above – then the bulls are in control of the market and vice versa. On April 2nd, 2019, Bitcoin made a huge...
Read More »
Yuval Gov
September 25, 2019
Bitcoin (BTC), Crypto news, Markets
Just yesterday we had warned from a Bitcoin price dump coming, as the coin was getting very close to the bottom line of the symmetrical triangle. Another warning sign came from the mini Death Cross between the 50 and the 100-days moving average lines, seen on the following daily chart.Those who don’t believe in technical analysis can’t ignore the fact that a triangle pattern was built since June, and for almost five months, we saw the triangle providing support and resistance for Bitcoin....
Read More »
Yuval Gov
September 24, 2019
Crypto news, Markets
Over the past two days, we had seen Bitcoin slowly melting down, marking the $9600 support as its current daily low.Bakkt futures launch, as expected, was more like a “sell on the news event.” So far, the volume there is very minimal, also when compared to the CME launch day, back in December 2017. Despite that, the CME futures gained volume over time, and this could also be the case with Bakkt.As could be seen on the following daily chart, the bigger picture is still the same: a giant...
Read More »
Yuval Gov
September 21, 2019
Bitcoin (BTC), Crypto news, Markets
Three days ago, on our previous Bitcoin price analysis, we had identified the “short-term” triangle on the 4-hour chart. We had also stated that Bitcoin is likely to reach the low of the “bigger” triangle (marked on the daily chart) in case of a breakout to the downside.As could be seen, Bitcoin had reached a low of $9,500 (BitMEX) following the breakdown of the 4-hour’s triangle formation around $10,160. An immediate plunge of more than $500.Was this the end? The significant “bigger”...
Read More »
Yuval Gov
September 18, 2019
Bitcoin (BTC), Crypto news, Markets
As been written on the previous price analysis, Bitcoin’s trading range is getting tighter and tighter. The king of cryptocurrencies is not used for trading with such low volatility.As can be seen on the following two time-frames – the daily chart and the 4-hour chart – Bitcoin is getting very close to the apex of its decision point for the short and the longer-term.Whether the next move will be bullish or bearish – it’s too early to state. There are reasons for both directions.There are...
Read More »