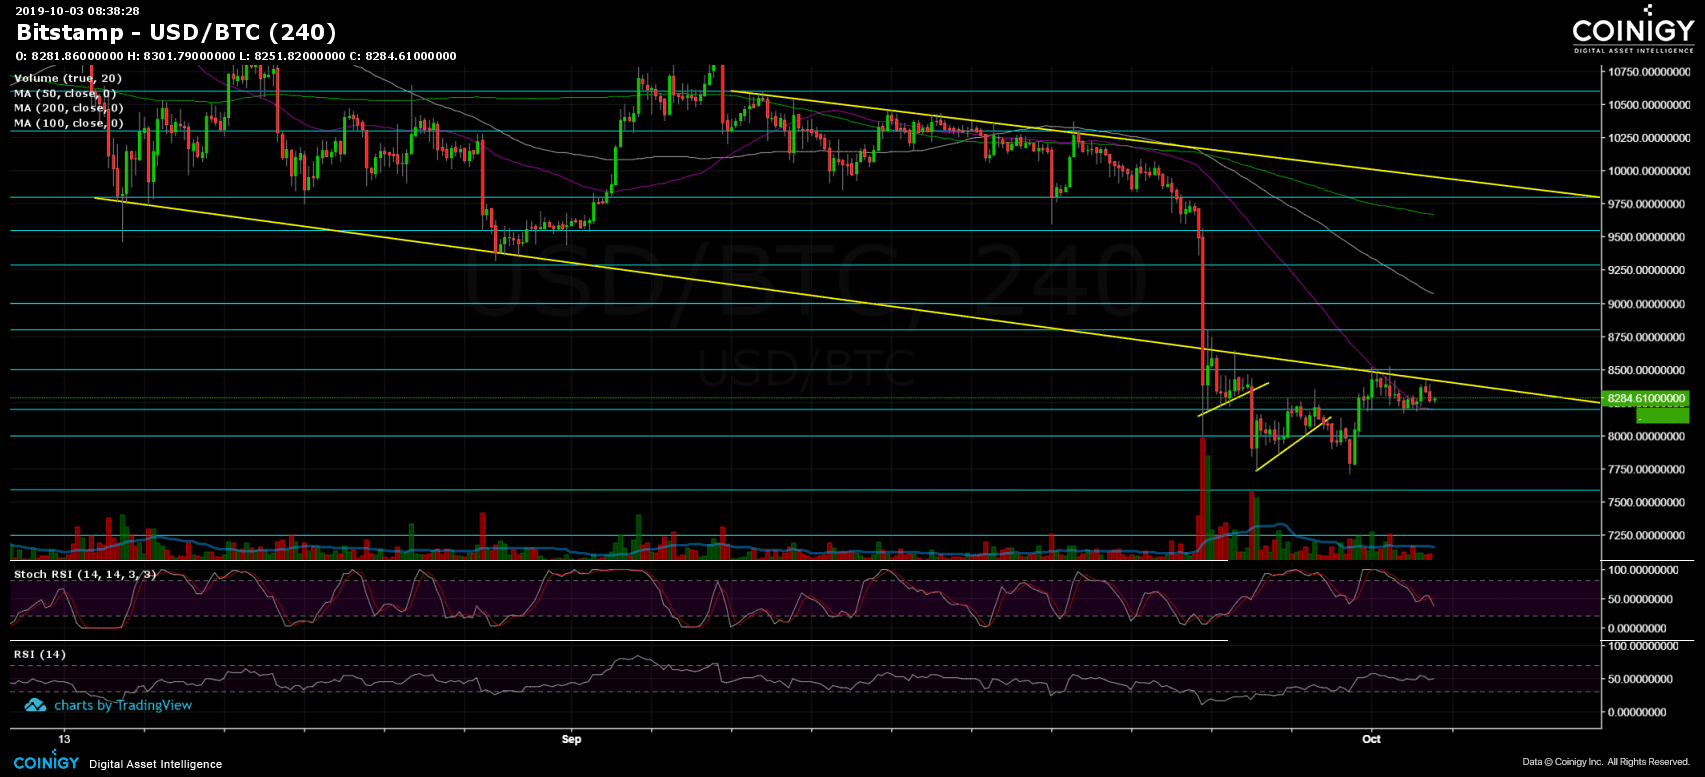
September was a tough month for Bitcoin. The famous cryptocurrency reached a high of nearly K before the end of the month’ plunge down to ,700. Over the past days, the first days of October, we saw Bitcoin price trying to recover in a continues consolidation between the marked descending trend-line on the following 4-hour chart and ,200 from below.This seems like another mini bearish triangle. These kinds of formations tend to breakdown; however, there’s always the possibility to overcome the mentioned descending trend-line, along with the next serious obstacle which is the 200-days moving average line (marked in light green on the following daily chart), which is close by.Another thing to note is that if there won’t be any momentum shift, the possibility for a Death Cross becomes
Topics:
Yuval Gov considers the following as important: BTCanalysis
This could be interesting, too:
Yuval Gov writes Bitcoin Price Analysis: BTC Struggles To Maintain Critical Support Level, Drop To 00 Very Soon?
Yuval Gov writes Bitcoin Completes 3-Day 00 Plunge: Where Is The Bottom? Price Analysis & Weekly Overview
Yuval Gov writes Bitcoin Price Analysis: After 0 Plunge In 48 Hours, Bitcoin Is Facing Huge Critical Support Area
Yuval Gov writes Bitcoin Price Analysis: Following Decent 0 Surge – Is Bitcoin Ready To Conquer ,000 Again, Or Just A Temp Correction?
September was a tough month for Bitcoin. The famous cryptocurrency reached a high of nearly $11K before the end of the month’ plunge down to $7,700. Over the past days, the first days of October, we saw Bitcoin price trying to recover in a continues consolidation between the marked descending trend-line on the following 4-hour chart and $8,200 from below.
This seems like another mini bearish triangle. These kinds of formations tend to breakdown; however, there’s always the possibility to overcome the mentioned descending trend-line, along with the next serious obstacle which is the 200-days moving average line (marked in light green on the following daily chart), which is close by.
Another thing to note is that if there won’t be any momentum shift, the possibility for a Death Cross becomes real. The last takes place when the 50-days moving average line crosses below the 200-days line and is considered a very bearish sign. In contrast, the inverse cross, which is named Golden, took place last March, while Bitcoin was trading under $4,000. Not long afterwards, Bitcoin started its massive 3-month move towards the 2019 high at $13,880.
Total Market Cap: $220 billion
Bitcoin Market Cap: $149 billion
BTC Dominance Index: 67.6%
*Data by CoinGecko
Key Levels to Watch
– Support/Resistance:
As mentioned, Bitcoin is now facing the mid-term descending trend-line on the 4-hour chart. The next target is the MA-200 (200-days moving average, marked in light green on the daily chart), currently sitting around $8,480. Many see the MA-200 as the distinguish between the Bear and Bull market.
Further above is $8,750 – $8,800 resistance area, which contains the 38.2% Fibonacci retracement level. The next resistance lies at $9,000, whereas the real test for Bitcoin bulls is located at $9,400 – $9,500 which contains the ascending trend-line (of the famous 2019 bearish triangle which got broken recently, shown on the following daily chart) along with the 61.8% Fibonacci retracement level (the “Golden Fib”).
From the bearish side, the first significant support level lies at $8200, before the $8,000 level. Below, the low of September at $7,700 is maybe the most short-term significant support. In case of a breakdown, Bitcoin will likely to quickly see $7,500 and $7200, which is also the Fibonacci level of 61.8% since reaching the 2019 high last June.
– The RSI Indicator (Daily): Nothing new is coming on behalf of the RSI. The indicator is sitting on the border between the bearish territory to the neutral one (30). However, the Stochastic RSI oscillator had made a crossover and moving now in the neutral area, which might give some fuel to break above the critical resistance.
– The Trading Volume: Since the huge breakdown a week ago, the total volume is declining over time. As of writing this, yesterday seems like the dull days of the first two weeks during September. This setting probably indicates a short-term coming up move.


