Following the huge price dump last Wednesday, we saw Bitcoin trading in the tight range between 50 and 50 until a few hours ago, where the primary cryptocurrency had decided to fire some engines towards a critical resistance level.As of writing these lines, Bitcoin is testing the 00 – ,000 resistance. As mentioned in our previous analysis, the 00 horizontal resistance is also the Golden Fib retracement level (61.8%, lies at 22). As can be seen on the following daily chart, this resistance is also a retest of the mid-term ascending trend-line (marked yellow).While Bitcoin is in the middle of another weekend, we need to keep in mind a possible CME Futures gap waiting at 30. Those gaps usually tend to get filled very quickly.Total Market Cap: 6 billionBitcoin Market
Topics:
Yuval Gov considers the following as important: Bitcoin (BTC) Price, BTCanalysis
This could be interesting, too:
Chayanika Deka writes XRP, SOL, and ADA Inclusion in US Crypto Reserve Pushes Traders on Edge
Chayanika Deka writes Why Arthur Hayes Is Bullish on Bitcoin Under Trump’s Economic Strategy
Mandy Williams writes Why the Bitcoin Market Is Stuck—and the Key Metric That Could Change It: CryptoQuant CEO
Jordan Lyanchev writes Liquidations Top 0M as Bitcoin Falls K, Reversing Trump-Driven Rally
Following the huge price dump last Wednesday, we saw Bitcoin trading in the tight range between $9550 and $9750 until a few hours ago, where the primary cryptocurrency had decided to fire some engines towards a critical resistance level.
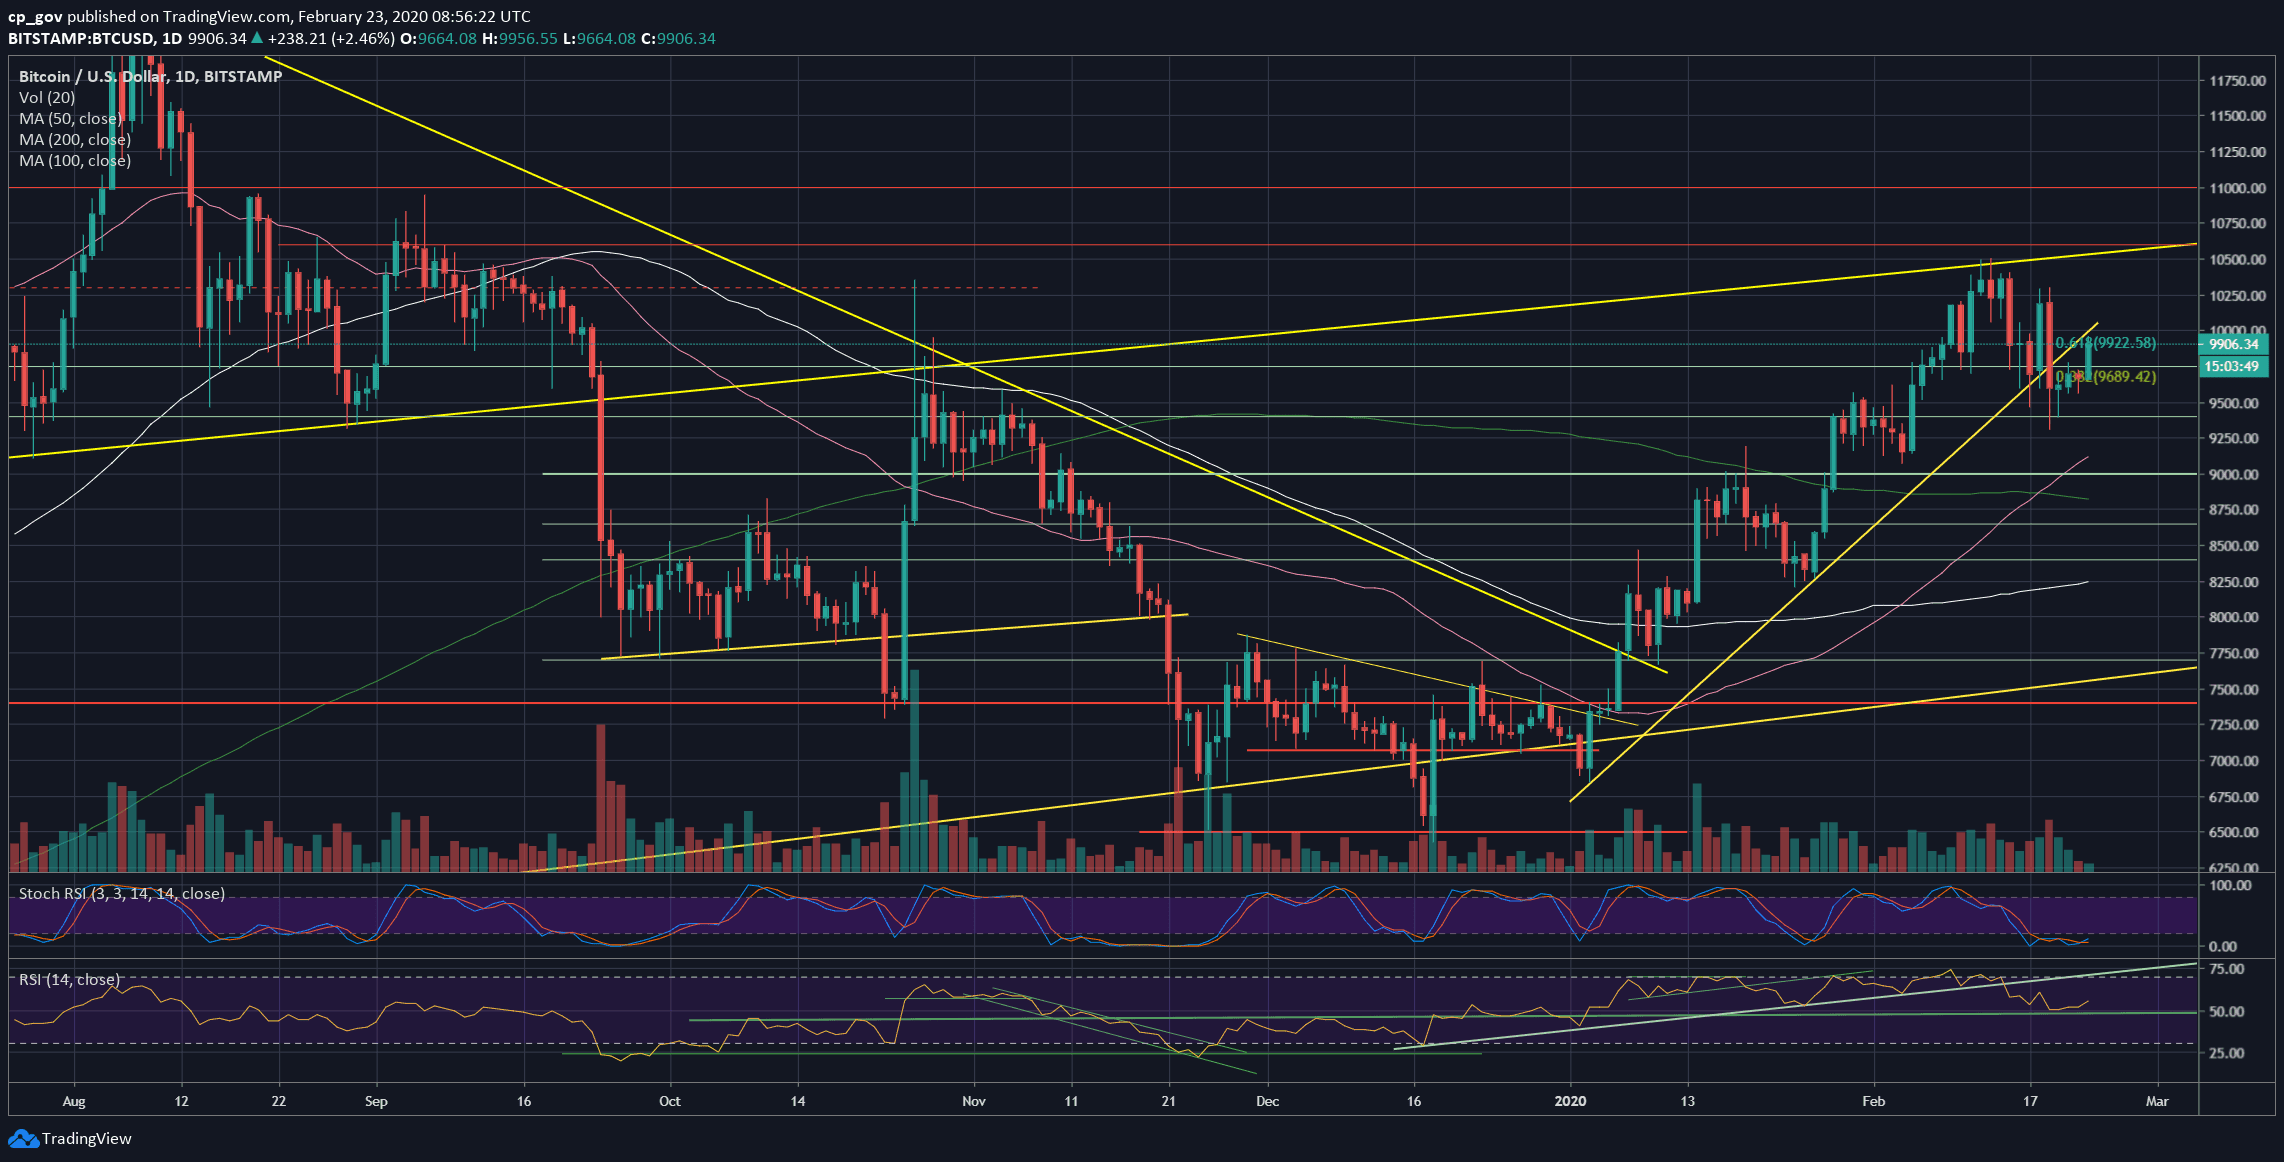
As of writing these lines, Bitcoin is testing the $9900 – $10,000 resistance. As mentioned in our previous analysis, the $9900 horizontal resistance is also the Golden Fib retracement level (61.8%, lies at $9922). As can be seen on the following daily chart, this resistance is also a retest of the mid-term ascending trend-line (marked yellow).
While Bitcoin is in the middle of another weekend, we need to keep in mind a possible CME Futures gap waiting at $9830. Those gaps usually tend to get filled very quickly.
Total Market Cap: $286 billion
Bitcoin Market Cap: $179.6 billion
BTC Dominance Index: 62.7%
*Data by CoinGecko
Key Levels To Watch & Next Possible Targets
– Support/Resistance levels: As mentioned above, the first level of resistance is the Golden Fib level (61.8%) at $9922, before the $10,000 benchmark. Higher above lies the past week’s high of $10,200 – $10,300, followed by $10,500 – where lies the current 2020 high.
From below, the first significant level of support lies at $9750. Further below lies $9550, followed by $9400, before the weekly low of Wednesday, which lies at $9300.
– The RSI Indicator: After a huge drop to the 50 RSI levels, the indicator found the needed support, and since then showing bullishness.
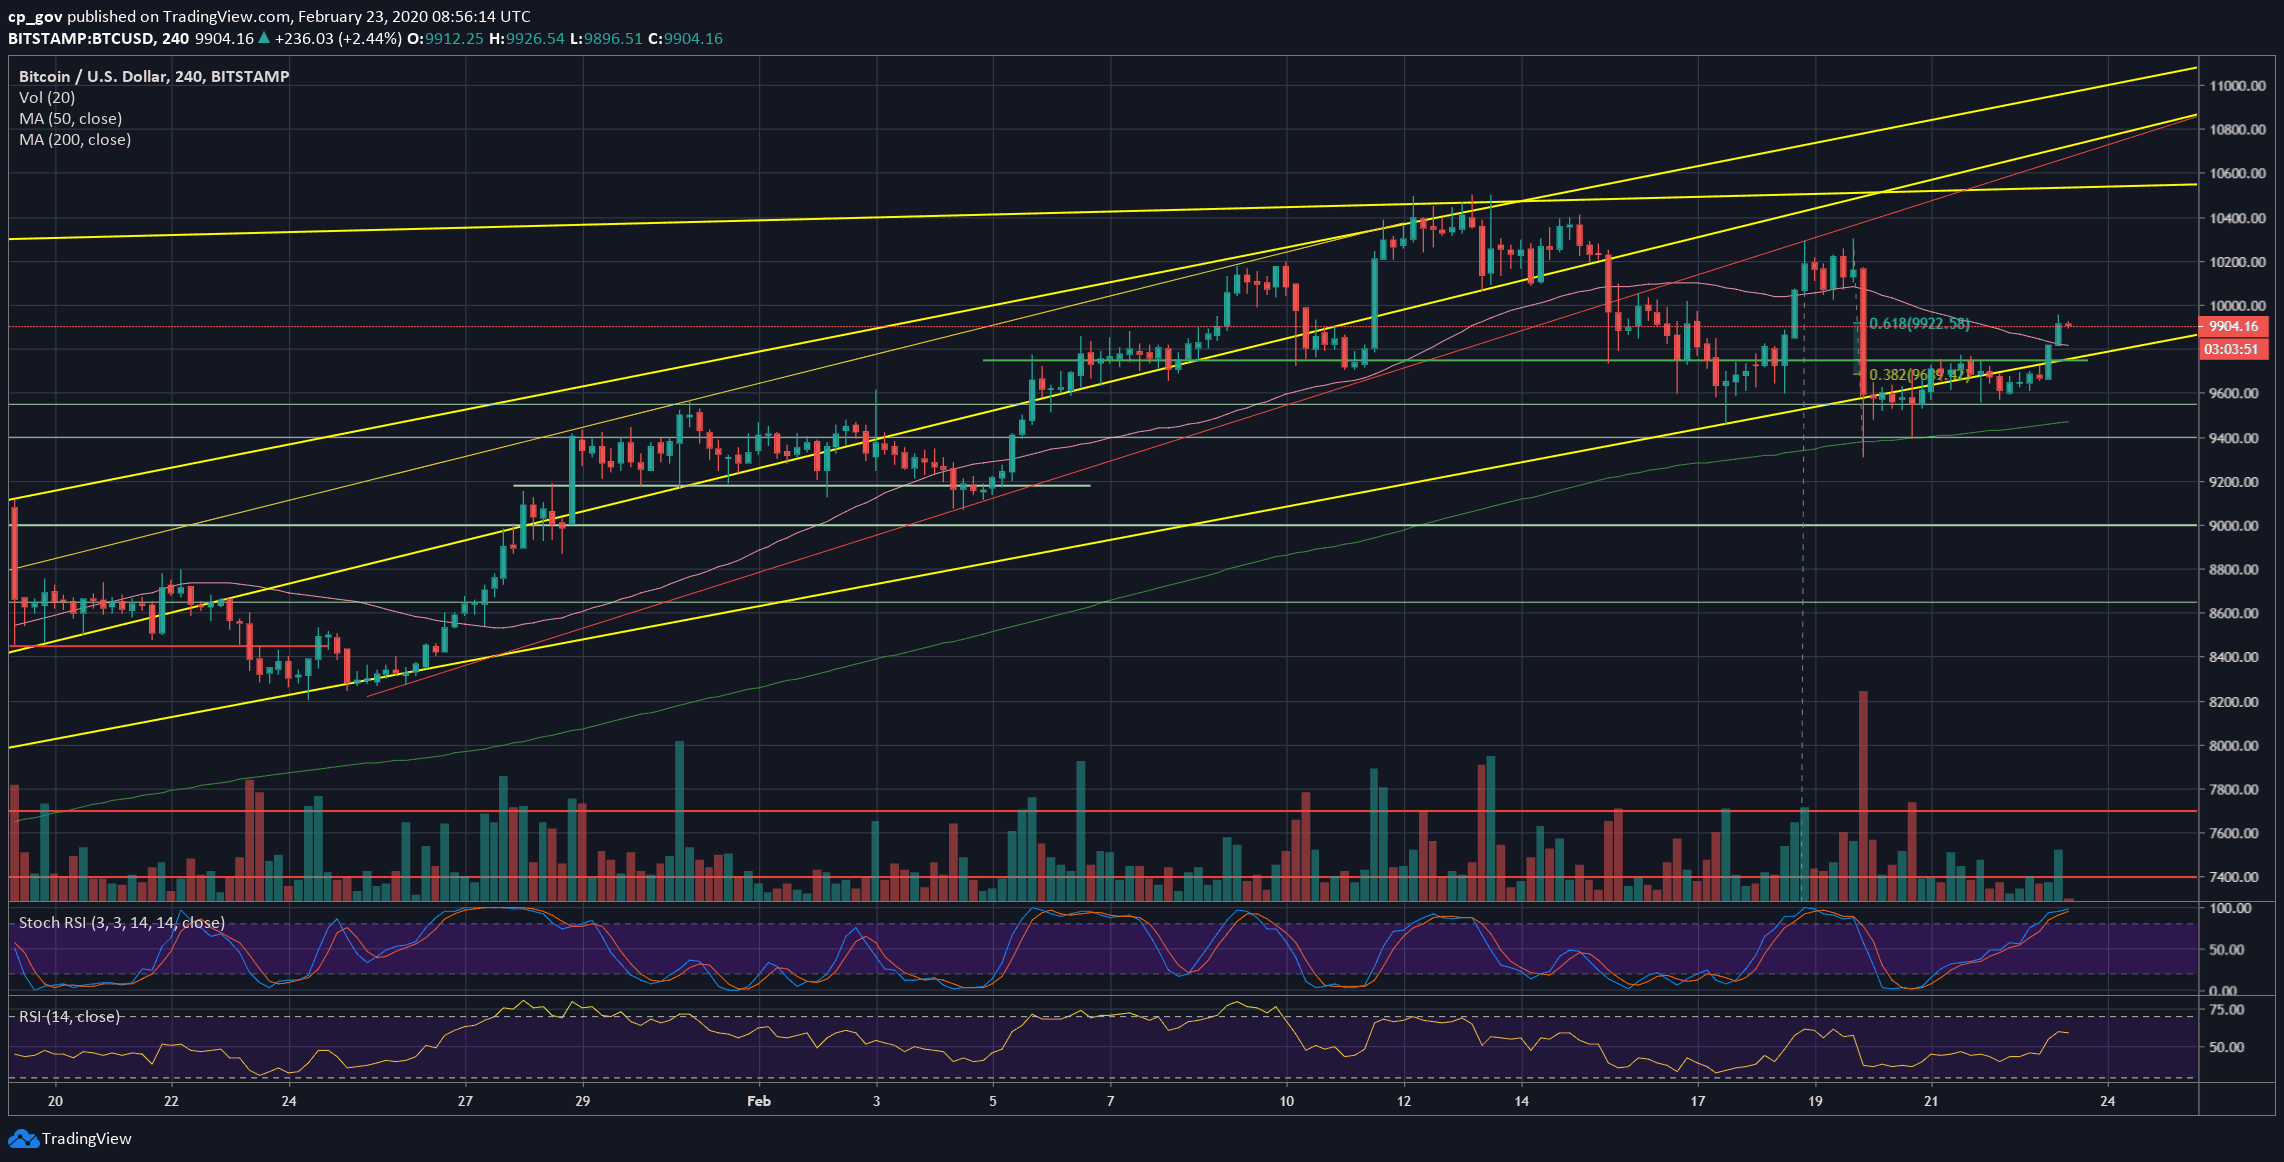
On the 4-hour chart (the lower time-frame), we can see a little bit of bullish price divergence starting to develop, which could be fuel for the next move up.
In addition, the Stochastic RSI oscillator had made a crossover in the oversold territory, and now about to enter the neutral zone, this could be another short-term bullish sign.
– Trading volume: Since Wednesday, we can see that the daily volume candles are declining. Yesterday had carried a minor amount of volume. This might be a sign that the next Bitcoin move is coming up. As a reminder, during weekends, the trading volume tends to be lower.
BTC/USD BitStamp 4-Hour Chart
BTC/USD BitStamp 1-Day Chart