And the volatility continues: The past three weeks for Bitcoin’s price were very volatile. While the coin reached its new year’s high at ,500, the fluctuations to both sides refuse to calm down over the past days.On our recent Bitcoin price analysis, we mentioned that Bitcoin was surging 0 intraday (towards the ,000) and that this, in high chance, also could turn into a temp correction before discovering new lows.Unfortunately to the bulls, and following the massive global markets crisis, Bitcoin had completed almost 0 drop in just two days.As of writing these lines, Bitcoin is testing crucial support of the mid-term ascending trend-line (can be seen on the following daily chart), along with the horizontal support at 00.Both the price and the RSI seem to be on a critical
Topics:
Yuval Gov considers the following as important: Bitcoin (BTC) Price, BTCanalysis
This could be interesting, too:
Chayanika Deka writes XRP, SOL, and ADA Inclusion in US Crypto Reserve Pushes Traders on Edge
Chayanika Deka writes Why Arthur Hayes Is Bullish on Bitcoin Under Trump’s Economic Strategy
Mandy Williams writes Why the Bitcoin Market Is Stuck—and the Key Metric That Could Change It: CryptoQuant CEO
Jordan Lyanchev writes Liquidations Top 0M as Bitcoin Falls K, Reversing Trump-Driven Rally
And the volatility continues: The past three weeks for Bitcoin’s price were very volatile. While the coin reached its new year’s high at $10,500, the fluctuations to both sides refuse to calm down over the past days.
On our recent Bitcoin price analysis, we mentioned that Bitcoin was surging $300 intraday (towards the $10,000) and that this, in high chance, also could turn into a temp correction before discovering new lows.
Unfortunately to the bulls, and following the massive global markets crisis, Bitcoin had completed almost $600 drop in just two days.
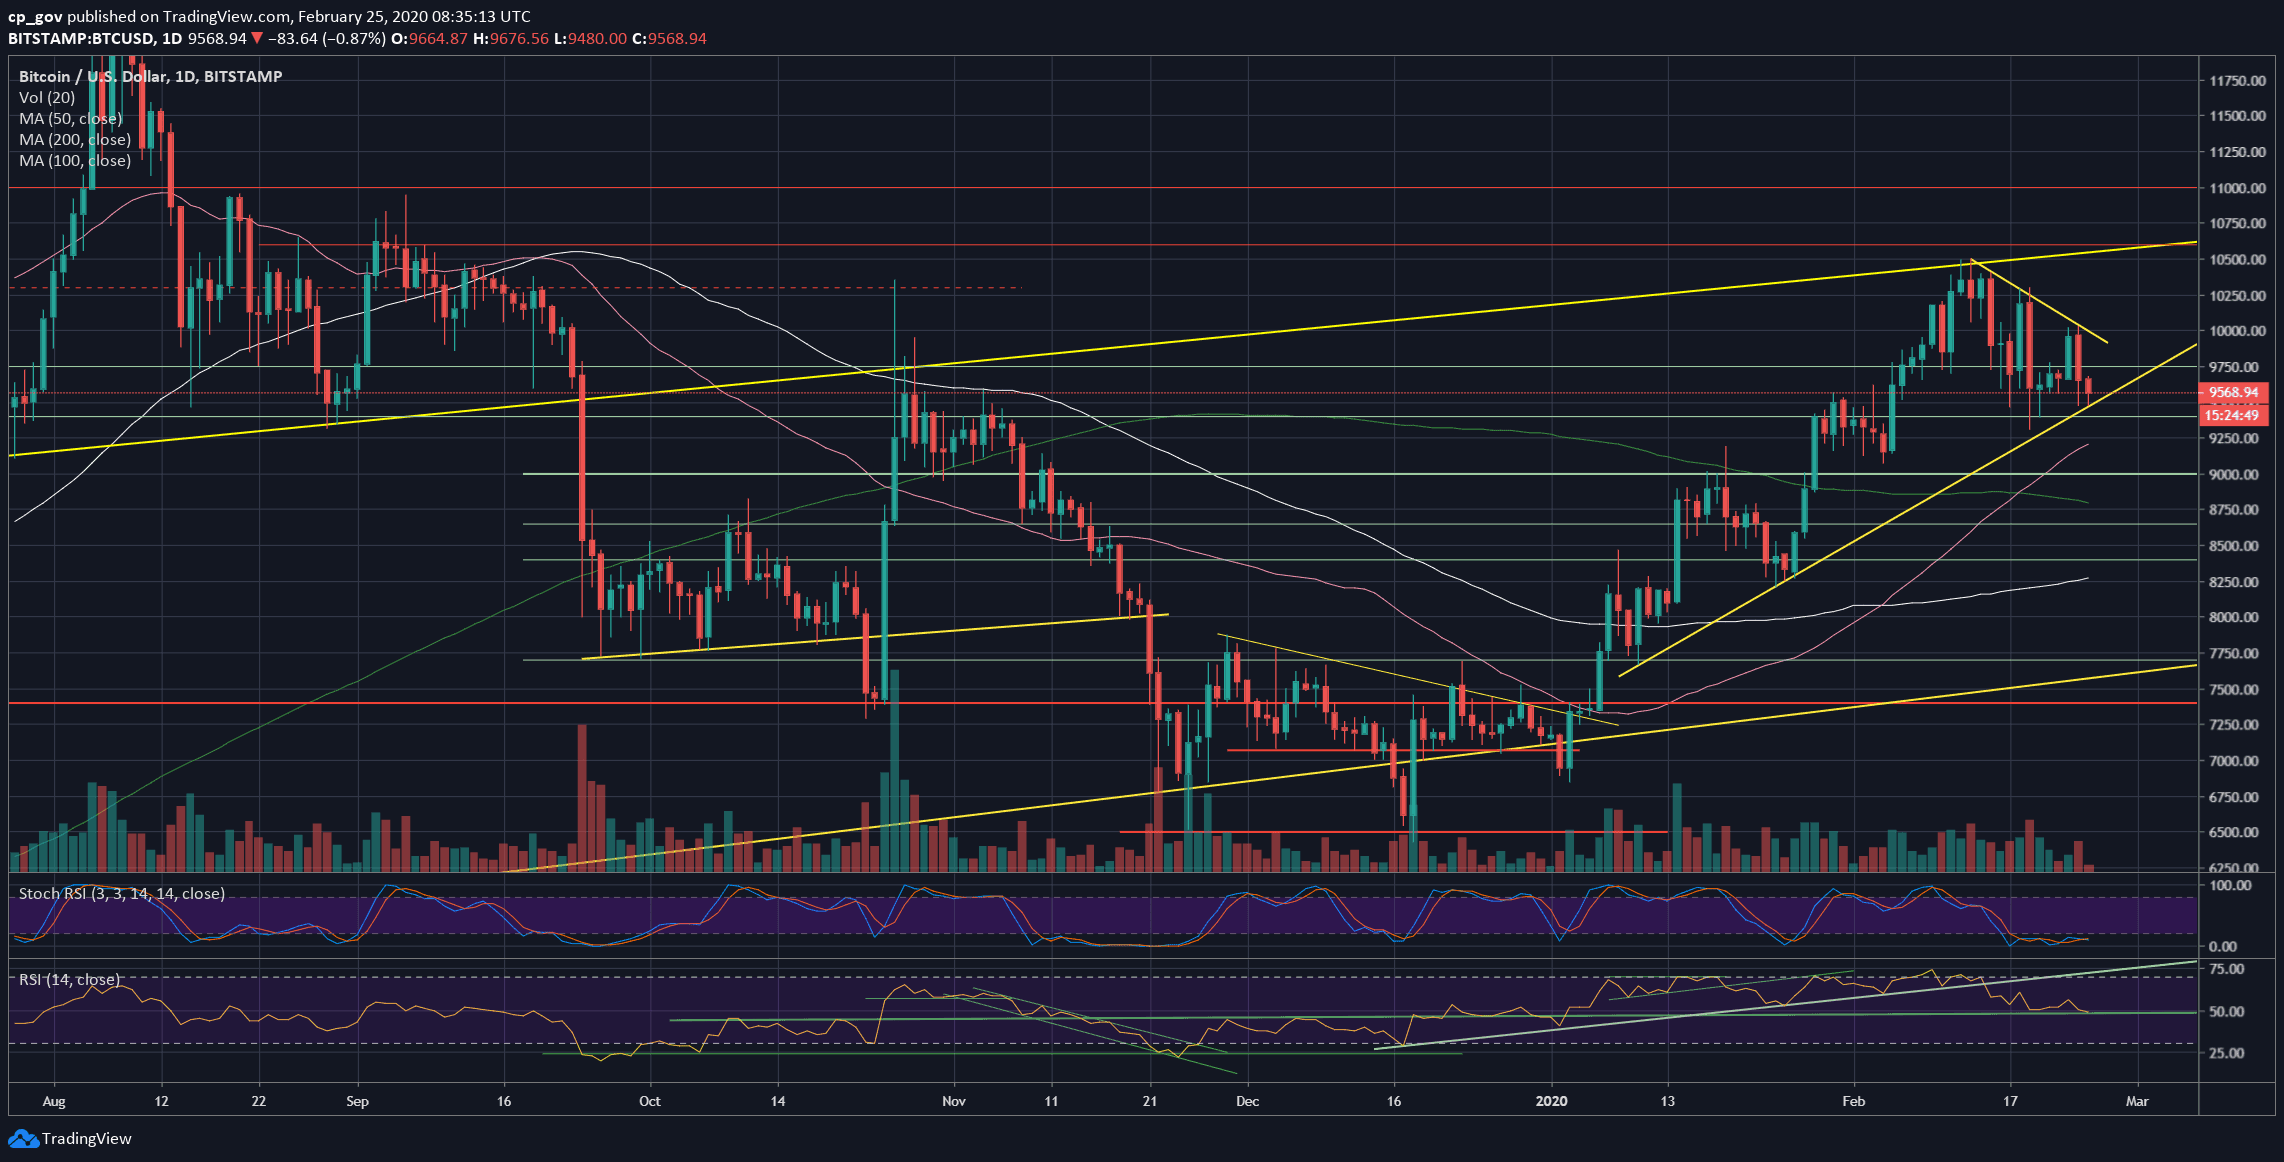
As of writing these lines, Bitcoin is testing crucial support of the mid-term ascending trend-line (can be seen on the following daily chart), along with the horizontal support at $9400.
Both the price and the RSI seem to be on a critical decision point. Losing the $9400 support zone means losing the higher lows trajectory on the daily, which might be crucial for the short-term price action of Bitcoin.
Another thing to keep in mind is the Bitcoin dominance ratio. After reaching almost 60%, the altcoins were starting to lose momentum against Bitcoin.
In other words, it means cash out from altcoins to Bitcoin, and from Bitcoin to FIAT. It could be related to the latest fear in the global markets: when there’s panic – people tend to sell everything for cash.
Total Market Cap: $274 billion
Bitcoin Market Cap: $174 billion
BTC Dominance Index: 63.3%
*Data by CoinGecko
Key Levels To Watch & Next Possible Targets
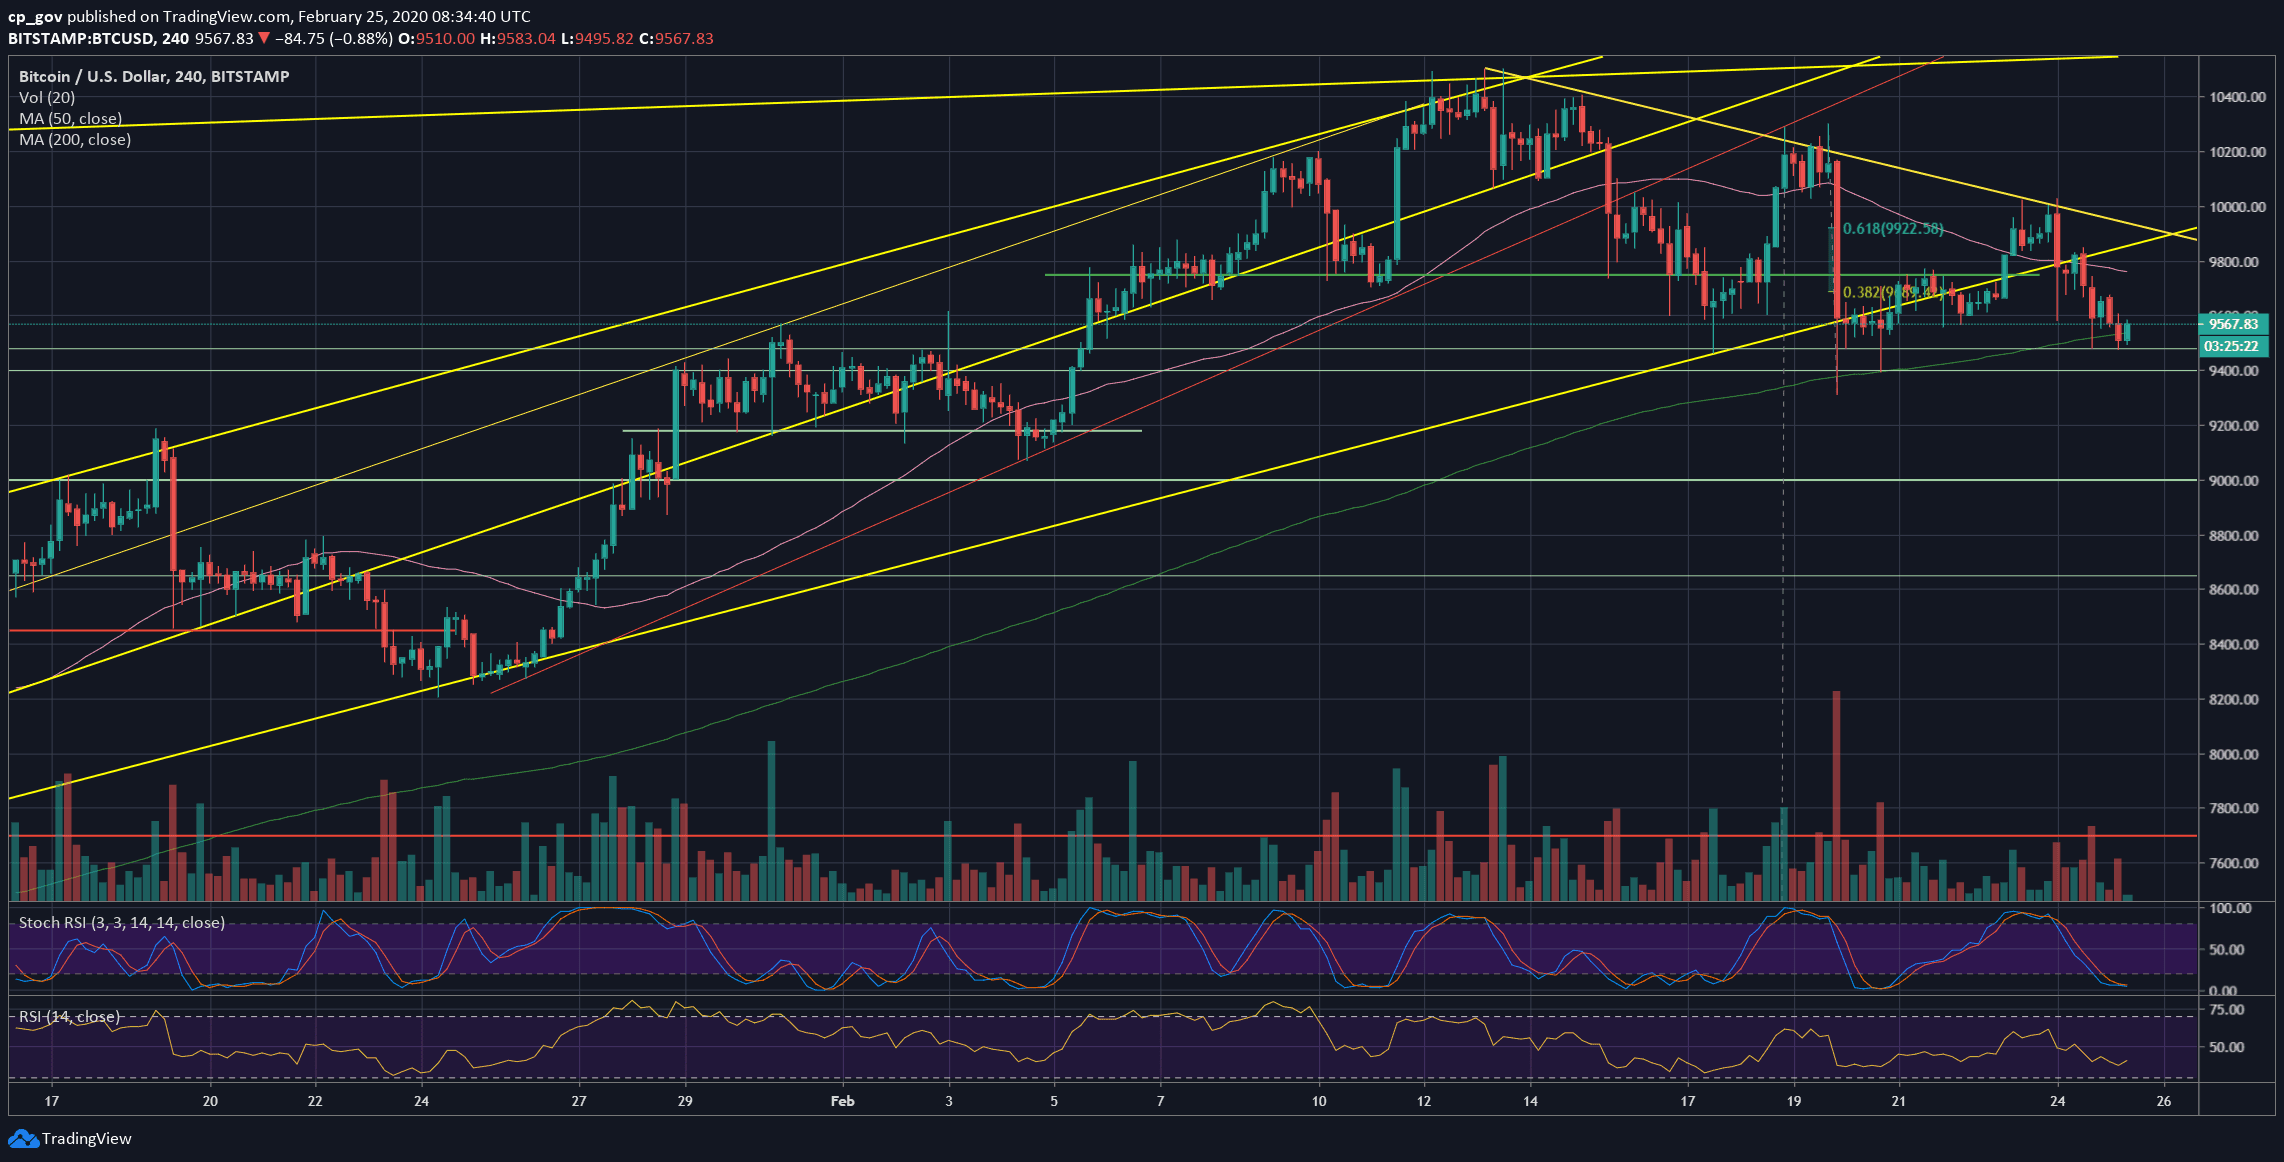
– Support/Resistance levels: As of writing these lines, Bitcoin price holds the mentioned above ascending line, along with $9400.
In case of a breakdown, then the first level of support is likely to be $9300 (this week’s low), before $9200, along with the 50-days moving average line (marked with pink). Further down is the $9000 horizontal support and $8800, which contains the significant 200-days moving average line.
In case Bitcoin finds support here, then the first level of resistance would be $9600 and $9750. Further above is the short-term descending trend-line (currently around $9800 – $9900), and $9900.
– The RSI Indicator: As mentioned above, the RSI is facing a substantial long-term support line from October 2019, along with the 50-horizontal level. This is definitely a decision point.
– Trading volume: An average amount of volume followed the recent 2-day drop. So far, everything is under control and looks like a deeper correction.
BTC/USD BitStamp 4-Hour Chart
BTC/USD BitStamp 1-Day Chart