There is the endless argument about whether Bitcoin is a safe-haven asset like Gold. This could be true most of the time; however, Wall Street and the global markets are facing a difficult situation resulting in a fatal drop of almost 8% over the past four days, surrounding the coronavirus effects.And Bitcoin, this time, correlates accurately with the global markets. The primary cryptocurrency continues its drop from yesterday, and completes over a 00 loss of value in the past three days. This comes following yesterday’s bloodbath, which saw another 3% plunge in Wall Street’s major indexes.Bitcoin had reached our yesterday’s mentioned target at 00, and as of writing these lines, struggling to maintain the crucial support level.Weekly OverviewFollowing the odd price action, let’s have
Topics:
Yuval Gov considers the following as important: Bitcoin (BTC) Price, BTCanalysis
This could be interesting, too:
Chayanika Deka writes XRP, SOL, and ADA Inclusion in US Crypto Reserve Pushes Traders on Edge
Chayanika Deka writes Why Arthur Hayes Is Bullish on Bitcoin Under Trump’s Economic Strategy
Mandy Williams writes Why the Bitcoin Market Is Stuck—and the Key Metric That Could Change It: CryptoQuant CEO
Jordan Lyanchev writes Liquidations Top 0M as Bitcoin Falls K, Reversing Trump-Driven Rally
There is the endless argument about whether Bitcoin is a safe-haven asset like Gold. This could be true most of the time; however, Wall Street and the global markets are facing a difficult situation resulting in a fatal drop of almost 8% over the past four days, surrounding the coronavirus effects.
And Bitcoin, this time, correlates accurately with the global markets. The primary cryptocurrency continues its drop from yesterday, and completes over a $1000 loss of value in the past three days. This comes following yesterday’s bloodbath, which saw another 3% plunge in Wall Street’s major indexes.
Bitcoin had reached our yesterday’s mentioned target at $9000, and as of writing these lines, struggling to maintain the crucial support level.
Weekly Overview
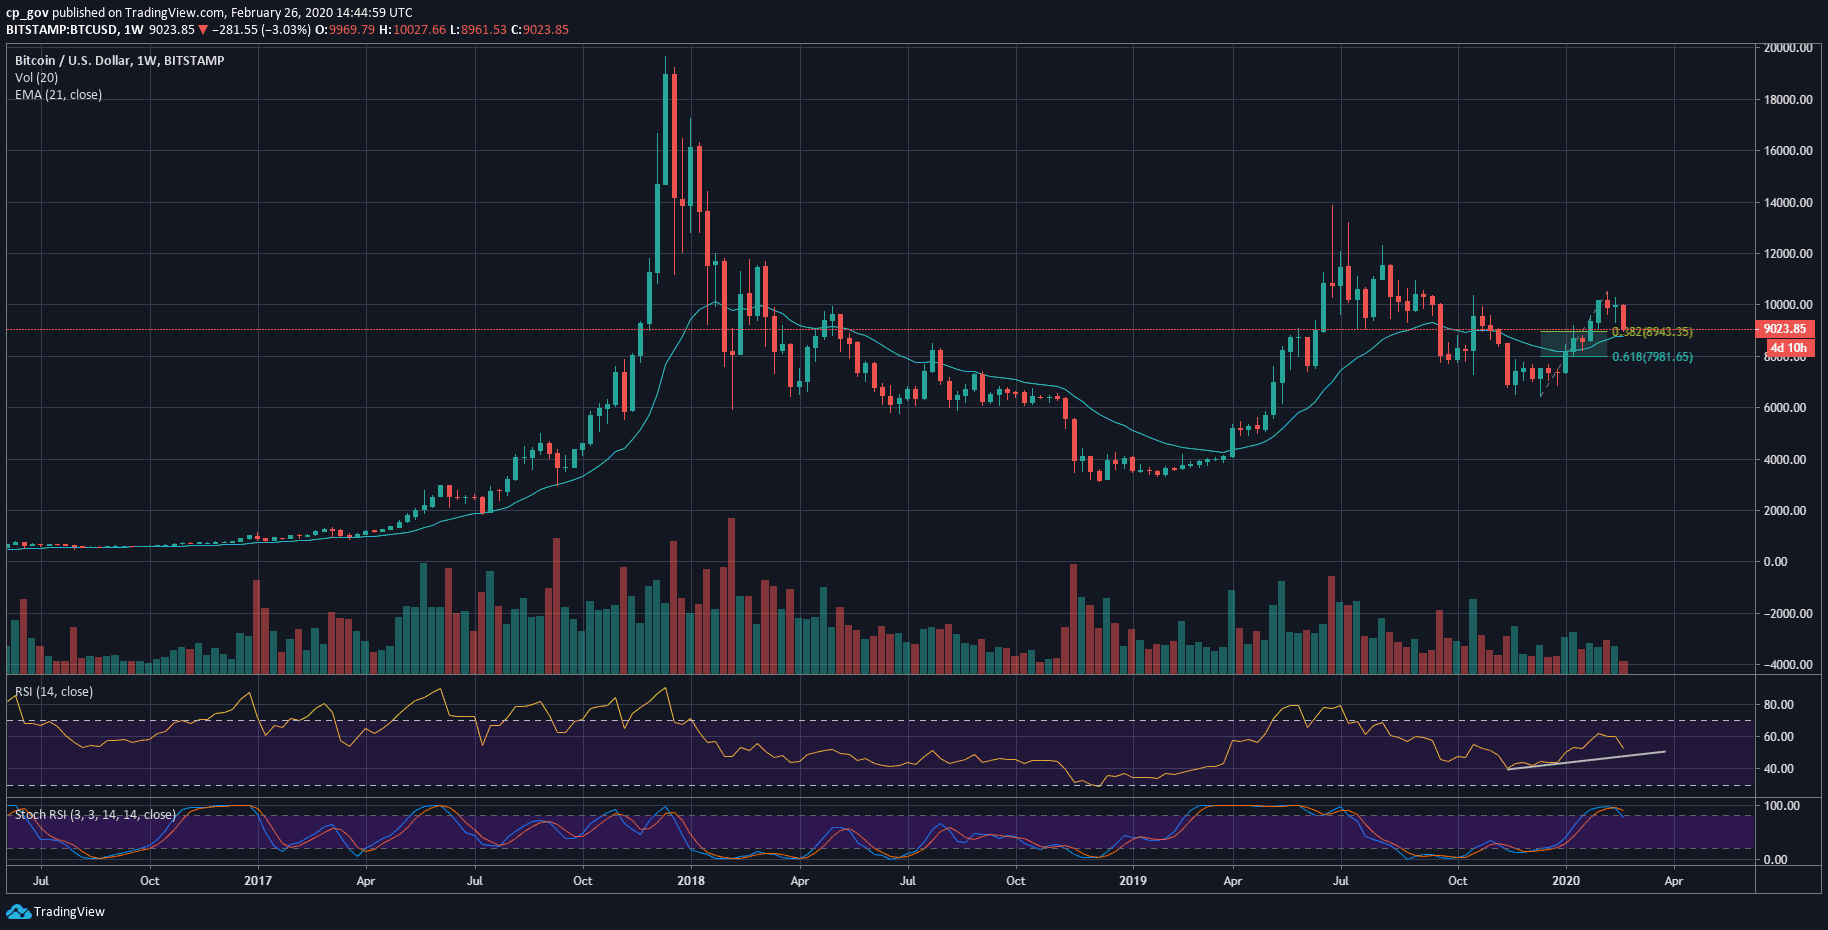
Following the odd price action, let’s have a look at the bigger timeframe, which is the weekly chart shown below.
As we can see, Bitcoin is nearing the significant support of the 21-EMA line (exponential moving average, marked by the light blue line), which lies approximately at $8800. The latter price level is also the significant 38.2% Fibonacci retracement level of the Bullish move from the past two months (since 2020 begun).
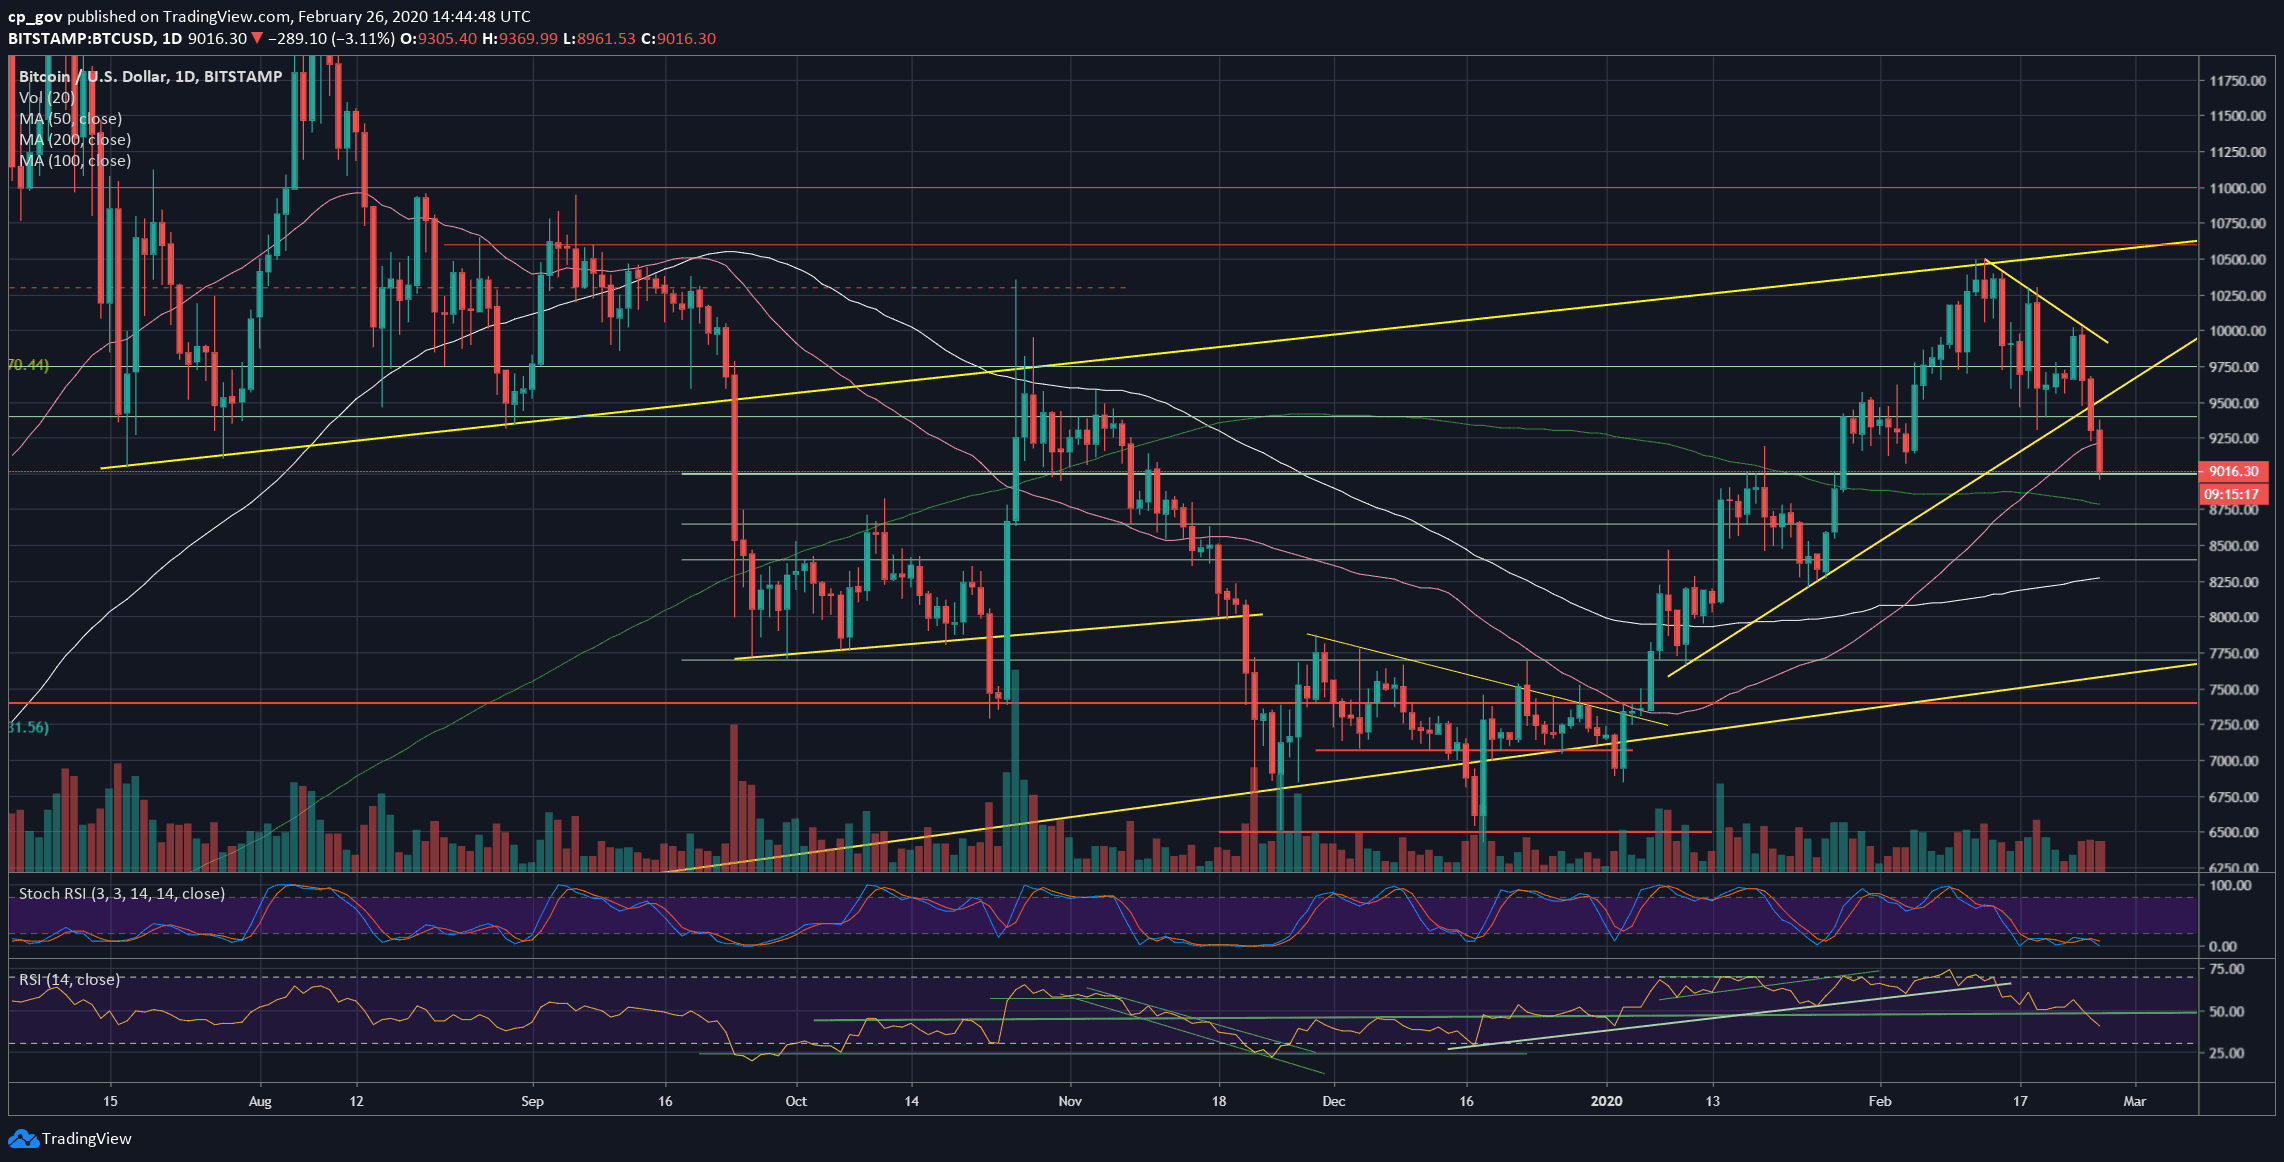
The $8800 also contains the 200-days moving average line (marked by the light green line on the daily chart).
In case Bitcoin breaks down the $8800 support zone, then the next possible target could be $8400 – $8500. Further down lies $8000, which is the 61.8% Fib retracement level.
Total Market Cap: $255 billion
Bitcoin Market Cap: $165 billion
BTC Dominance Index: 64.5% (BTC Dominance continues to surge. Funds are moving from the altcoins into cash)
*Data by CoinGecko
Key Levels To Watch & Next Possible Targets
– Support/Resistance levels: From below – levels are stated above.
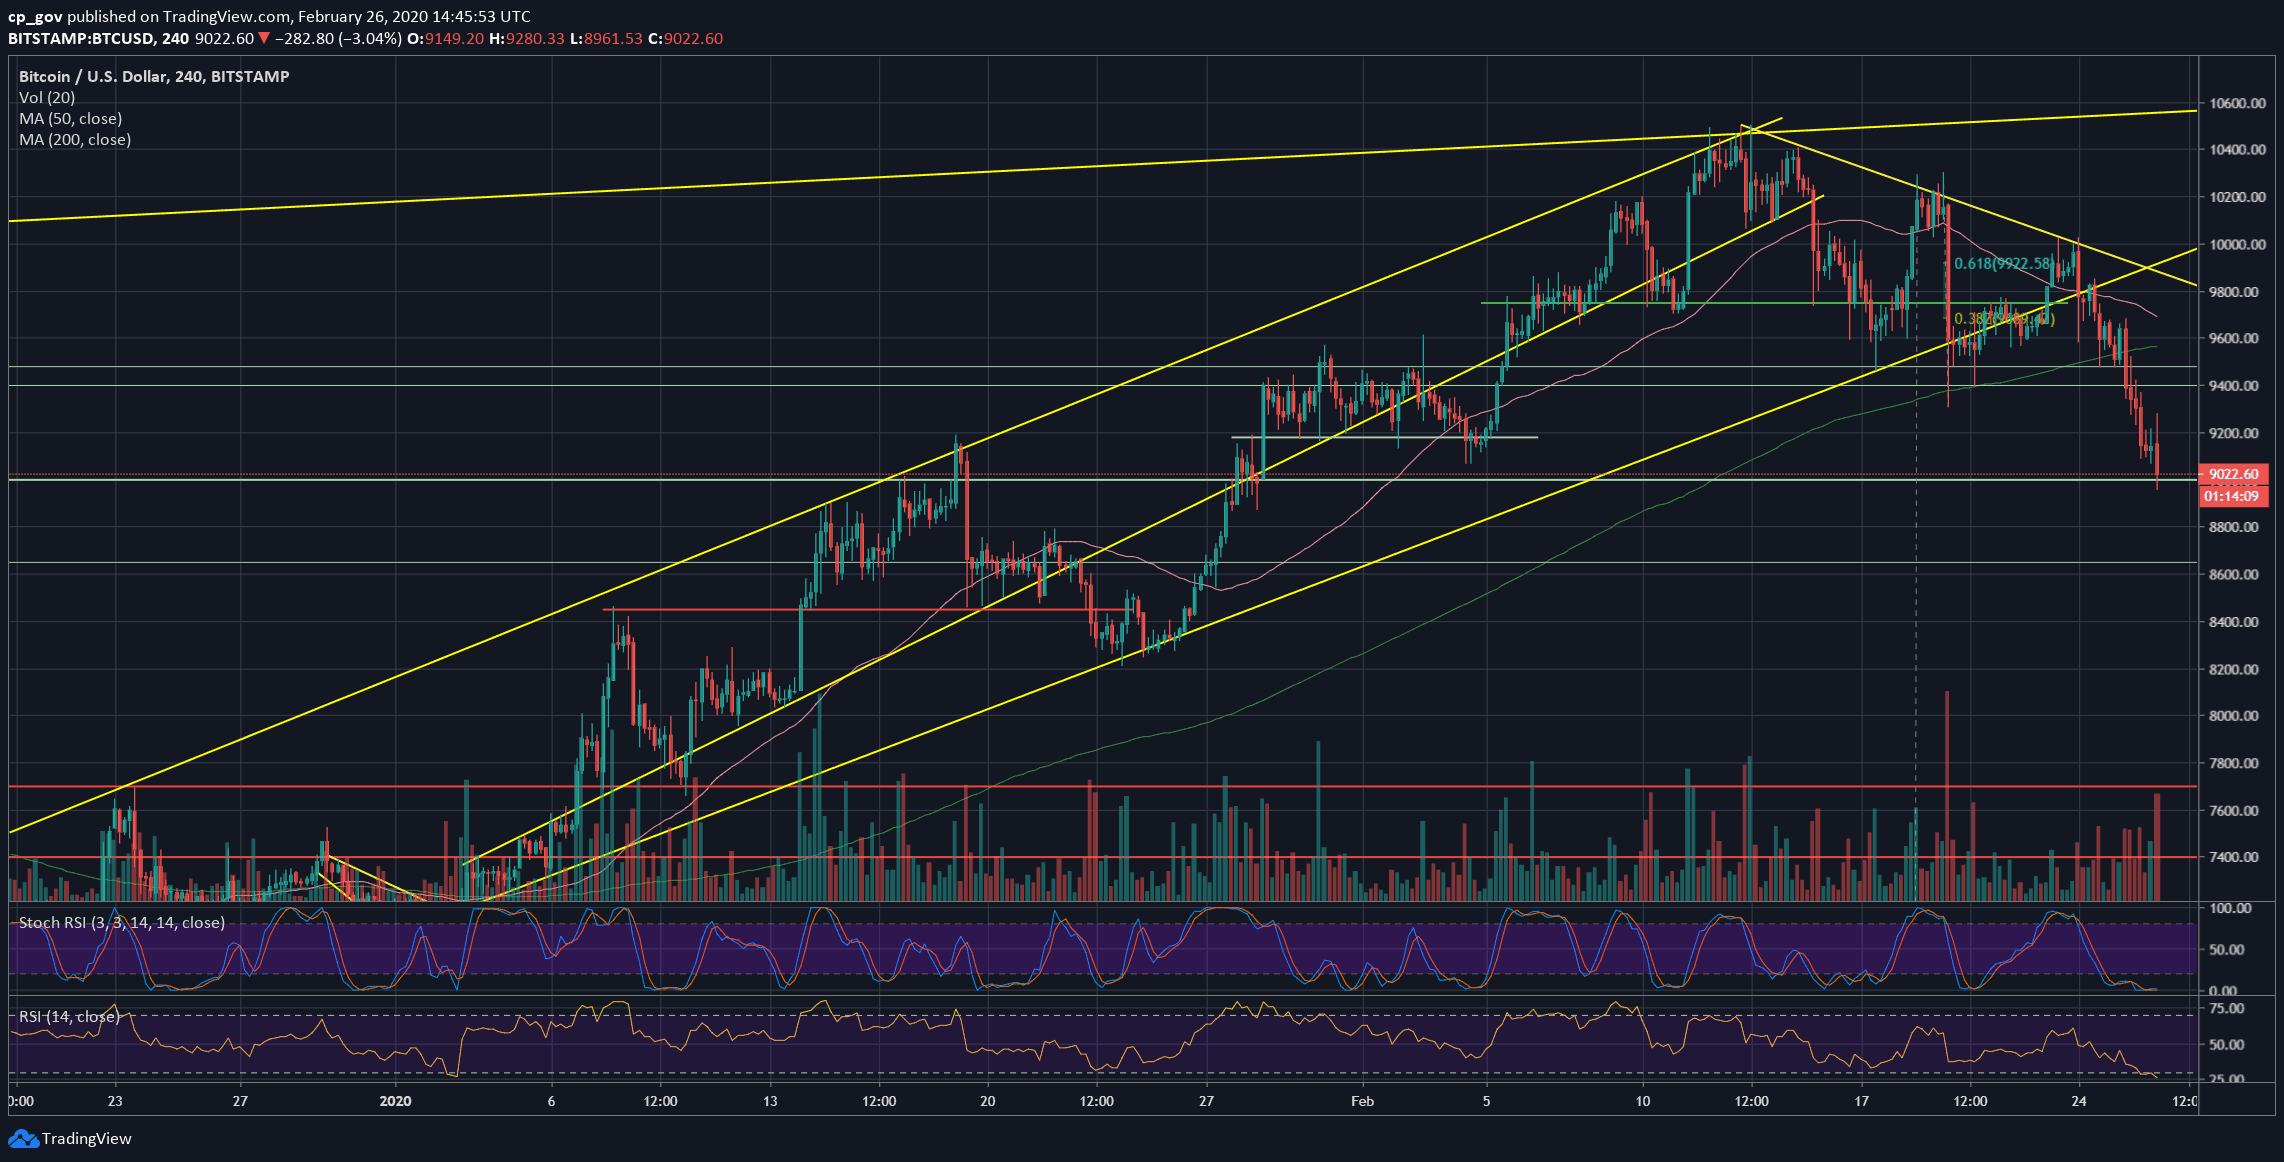
From the bullish side, in case that Bitcoin maintains the $9000 level, then the first level of resistance would be $9200, followed by $9300. Further above lies $9480 and $9750 support turned resistance levels.
– The RSI Indicator: The RSI broke the critical level from yesterday. As of now, the momentum indicator pointing down. This is the lowest level of the RSI since the middle of December 2019, when Bitcoin was trading for $6500.
– Trading volume: Despite the huge drop, the trading volume is so far, not very significant, at least by judging the major exchanges’ volume.
BTC/USD BitStamp 4-Hour Chart
BTC/USD BitStamp 1-Day Chart