Etheruem dropped by a total of 9% over the past 24 hours of trading as it falls to the 5 level.This retracement was expected after Ethereum double-topped at 5, causing it to roll over and start the decline.ETH also decreased against Bitcoin as it broke beneath support at the 0.026 BTC level; however, relative to other cryptocurrencies, it is holding strong.Key Support & Resistance LevelsETH/USD:Support: 5, 5, 0.Resistance: 0, 5, 0.ETH/BTC:Support: 0.0256 BTC, 0.025 BTC, 0.0242 BTC.Resistance: 0.027 BTC, 0.0278 BTC, 0.0288 BTC.ETH/USD: Ethereum Plummets Into .382 Fib RetracementSince our last analysis, Ethereum continued to drop after failing to break above resistance at 0. The cryptocurrency went on to fall beneath the mid-February support at 5 as it reached
Topics:
Yaz Sheikh considers the following as important: ETH Analysis, Ethereum (ETH) Price
This could be interesting, too:
Mandy Williams writes Ethereum Derivatives Metrics Signal Modest Downside Tail Risk Ahead: Nansen
CryptoVizArt writes Will Weak Momentum Drive ETH to .5K? (Ethereum Price Analysis)
Mandy Williams writes Ethereum Key Metrics Point to Persistent Bullish Outlook for ETH: CryptoQuant
CryptoVizArt writes Ethereum Price Analysis: Following a 15% Weekly Crash, What’s Next for ETH?
- Etheruem dropped by a total of 9% over the past 24 hours of trading as it falls to the $235 level.
- This retracement was expected after Ethereum double-topped at $285, causing it to roll over and start the decline.
- ETH also decreased against Bitcoin as it broke beneath support at the 0.026 BTC level; however, relative to other cryptocurrencies, it is holding strong.
Key Support & Resistance Levels
ETH/USD:
Support: $235, $225, $220.
Resistance: $250, $255, $270.
ETH/BTC:
Support: 0.0256 BTC, 0.025 BTC, 0.0242 BTC.
Resistance: 0.027 BTC, 0.0278 BTC, 0.0288 BTC.
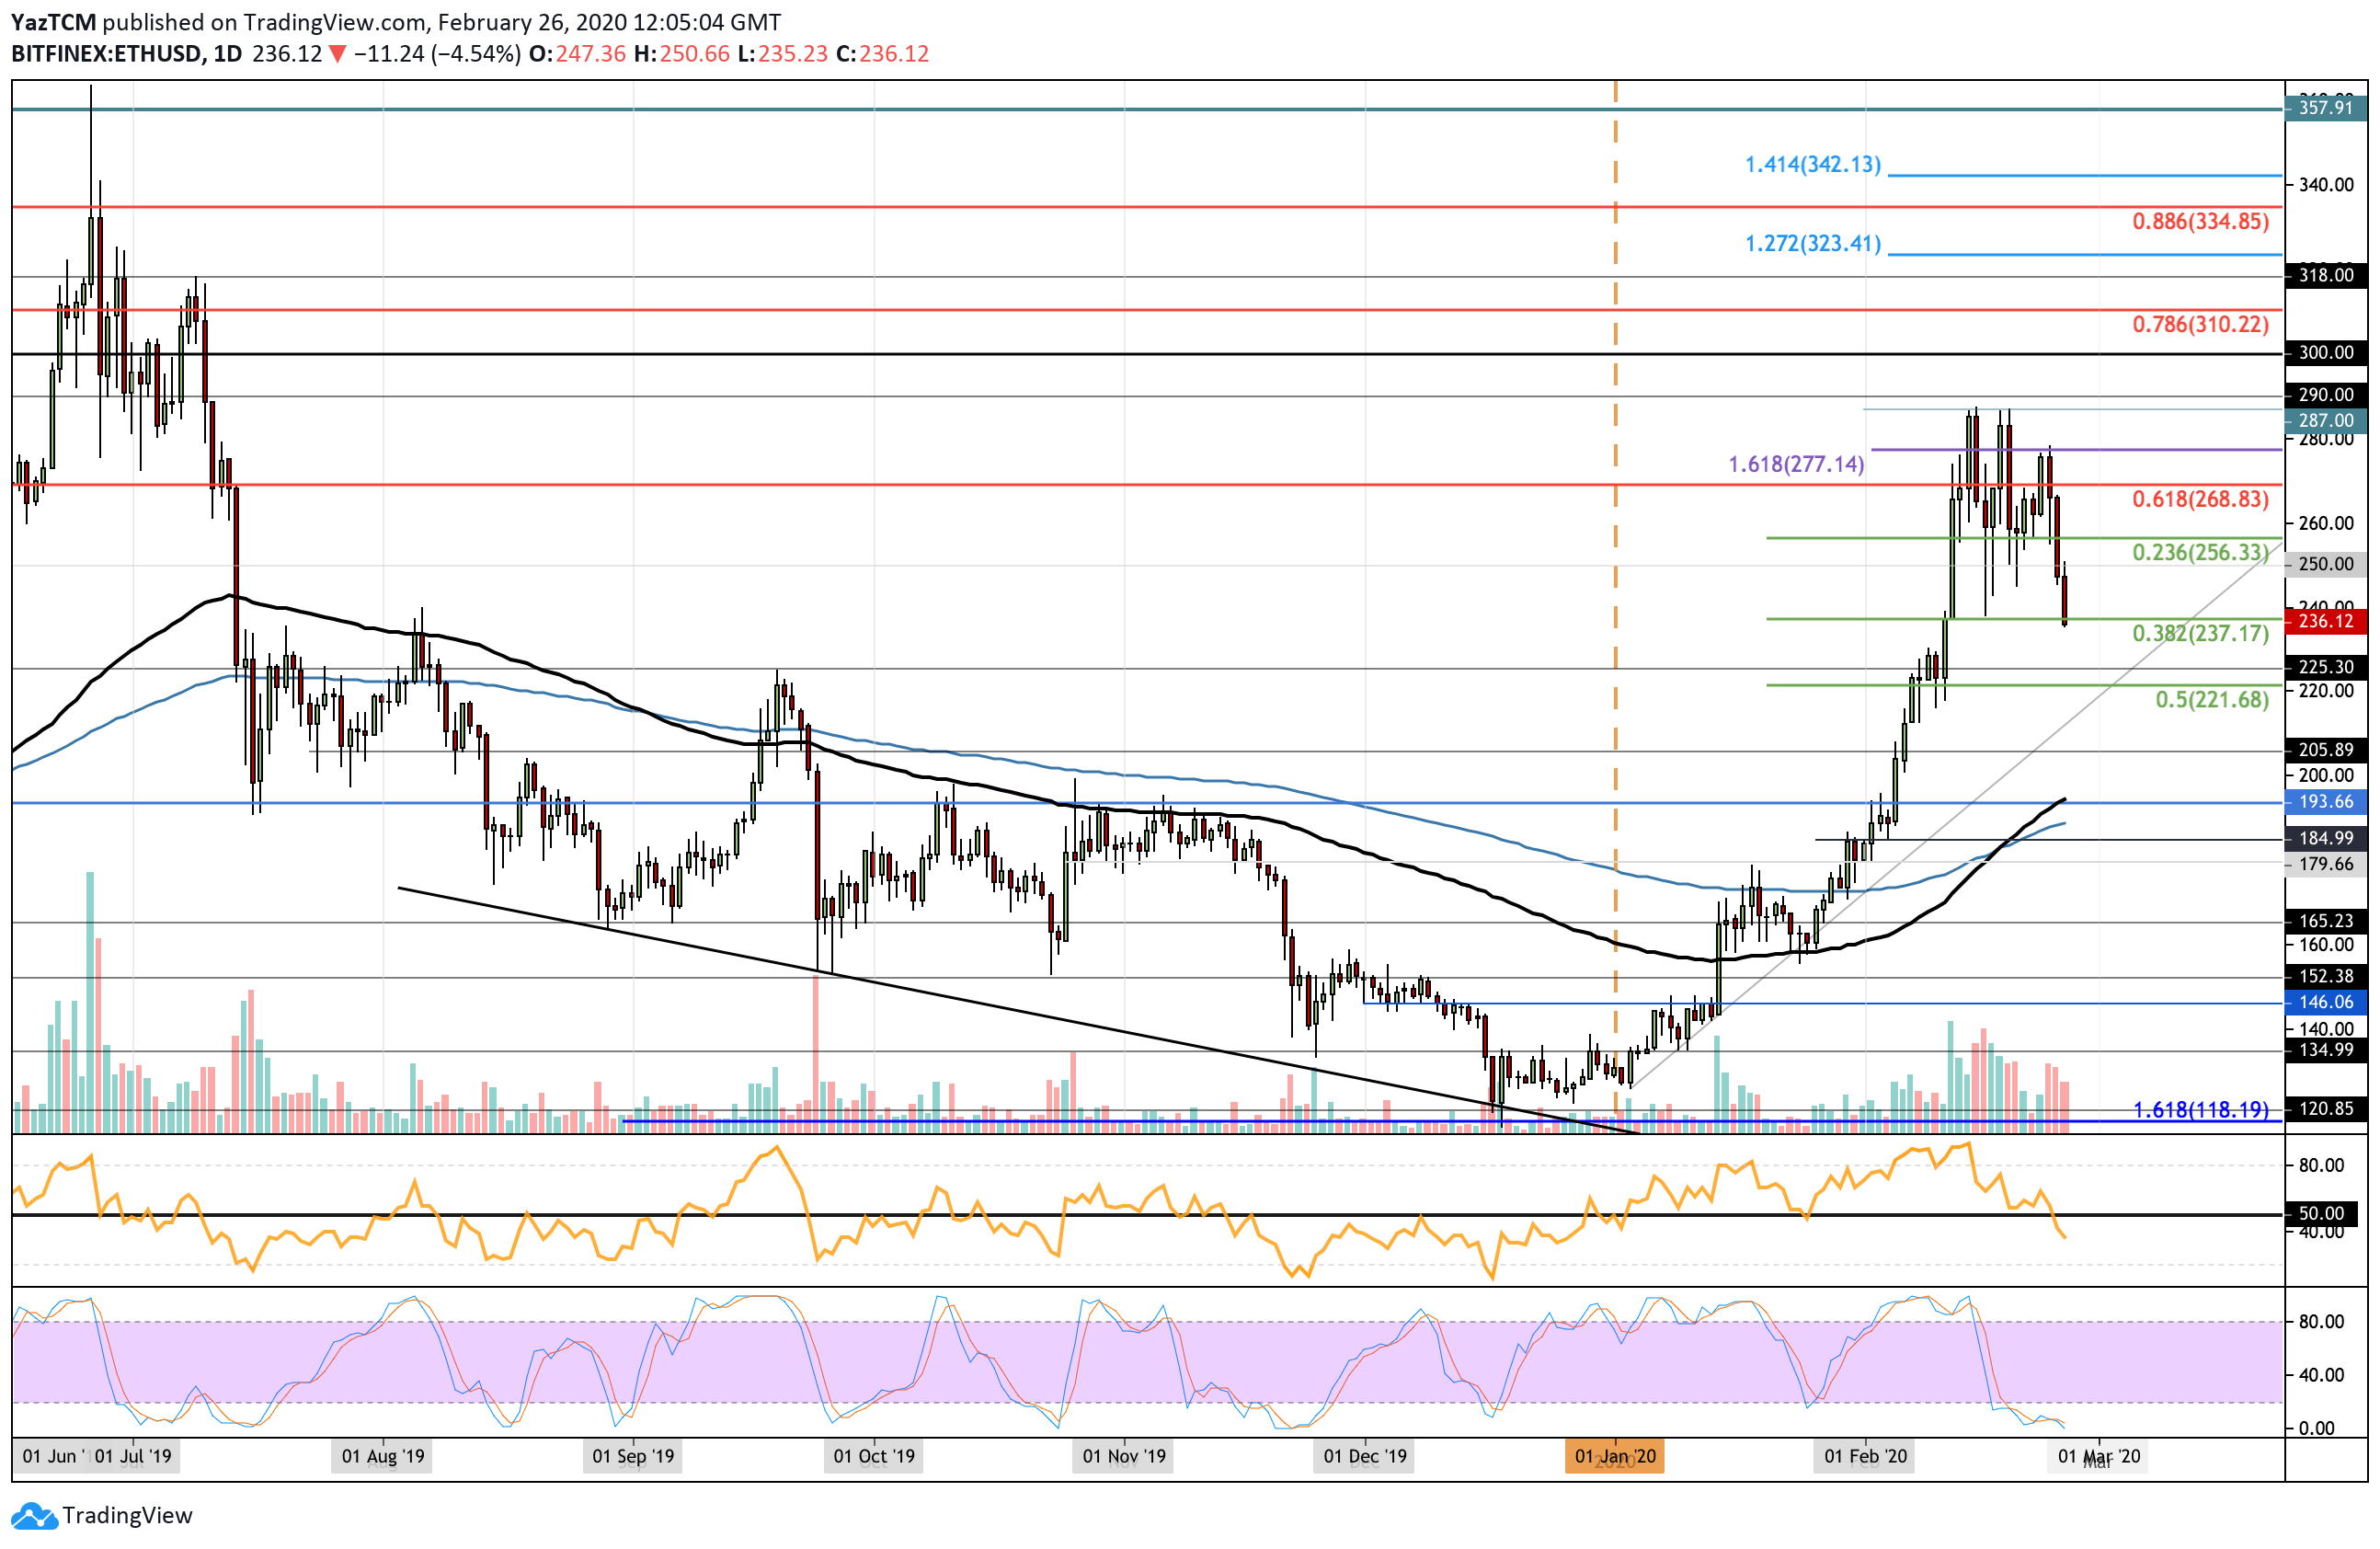
ETH/USD: Ethereum Plummets Into .382 Fib Retracement
Since our last analysis, Ethereum continued to drop after failing to break above resistance at $280. The cryptocurrency went on to fall beneath the mid-February support at $255 as it reached the .382 Fibonacci Retracement at around $235.
Ethereum is in danger of turning bearish at this moment in time, especially if it continues further beneath $235 and breaks below $220.
Ethereum Short Term Price Prediction
If the sellers break beneath $235, support is located at $225 and $220 (.5 Fibonacci Retracement level). This is followed by support at $205, $200, and $195 (100-days EMA).
On the other side, if the bulls rebound at $235, resistance is located at $250, $255, and $270.
The RSI has now broken beneath the 50 level for the first time in 2020 to indicate that the sellers have taken control over the market momentum. It is likely to continue to fall until reaching oversold conditions, which means that there will be more selling on the way.
The Stochastic RSI has been extremely oversold for a few days, and a bullish crossover signal will be the first sign that the selling pressure is about to fade.
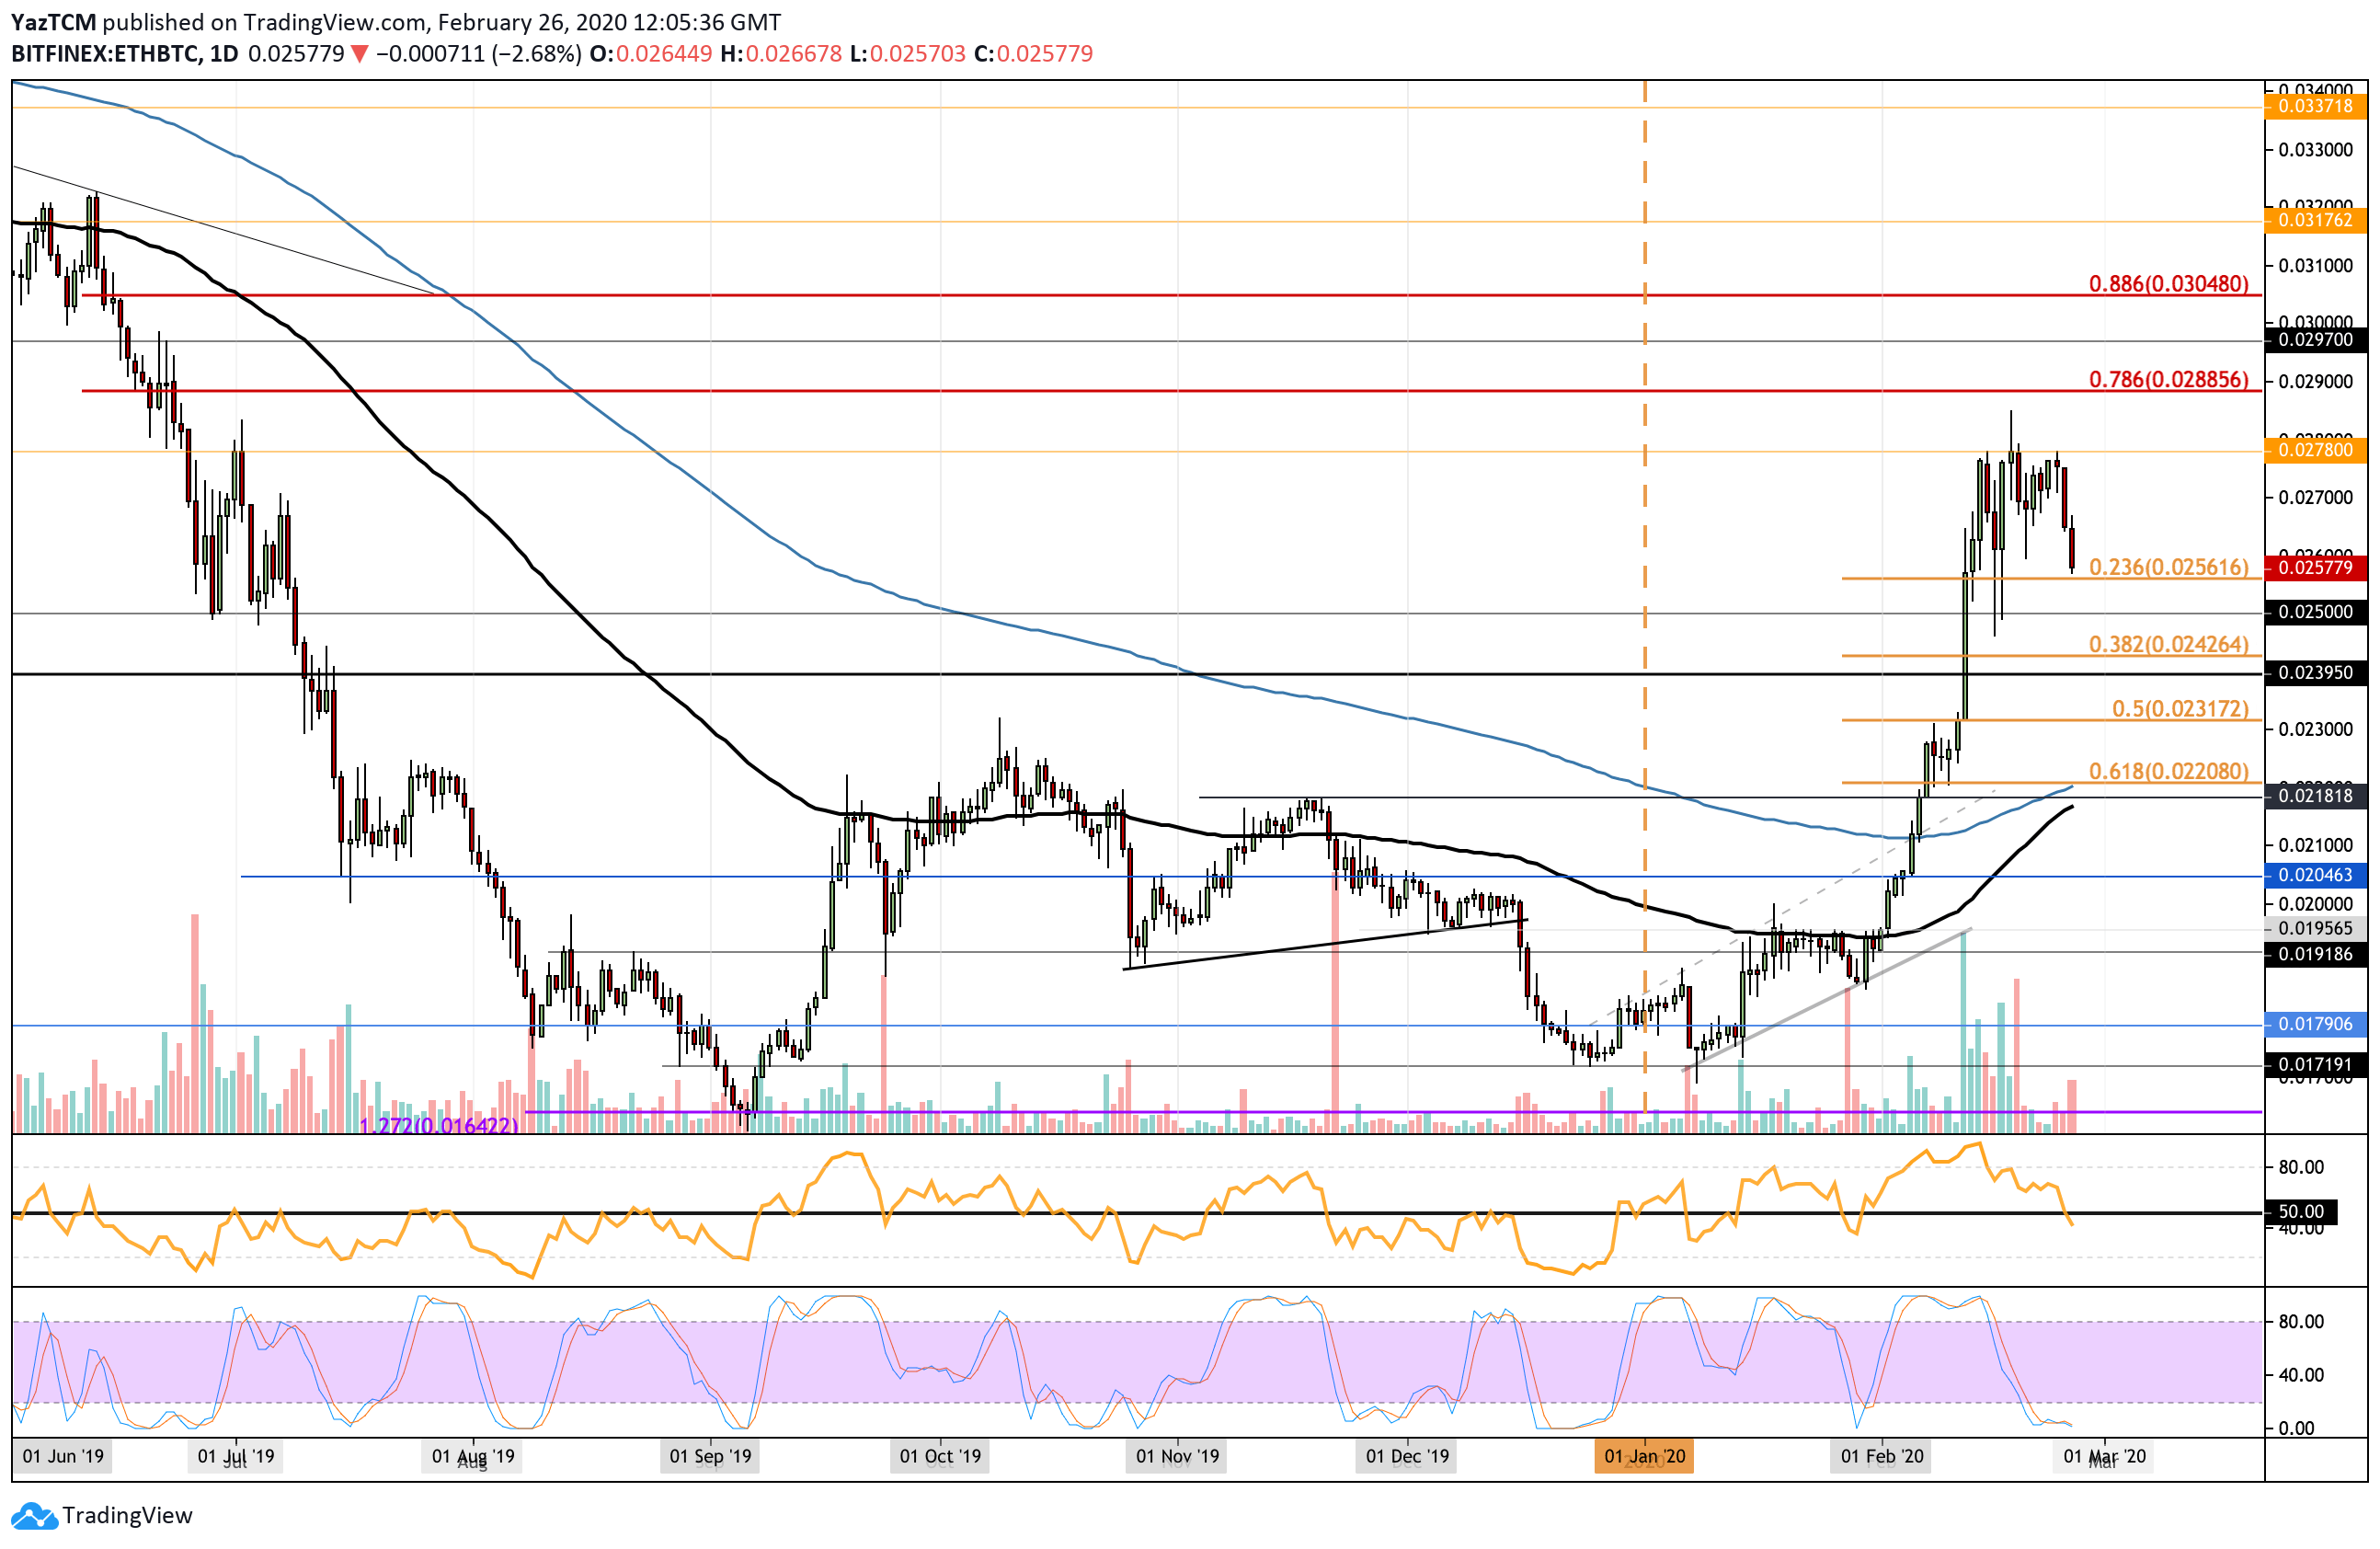
ETH/BTC – ETH Holding Relatively Strong Against BTC
Against Bitcoin, ETH made another attempt to break the 0.0278 BTC resistance but failed to do so, causing it to roll over and fall.
It broke beneath support at 0.027 BTC and 0.026 BTC to land at the current 0.0256 BTC price, provided by a short term .236 Fibonacci Retracement level.
ETH is holding pretty strong against BTC and can still be considered as bullish. However, if it continues to drop beneath 0.025 BTC, this bullish trend will be invalidated.
Ethereum Short Term Price Prediction
If the bulls manage to rebound at 0.0256 BTC and push higher, the first level of resistance lies at 0.027 BTC. Above this, additional resistance can be found at 0.0278 BTC (2020 resistance) and 0.0288 BTC (bearish .786 Fibonacci Retracement level).
Alternatively, if the sellers break 0.0256 BTC, support lies at 0.025 BTC. Beneath this, added support is found at 0.0242 BTC (.382 Fib Retracement), 0.0239 BTC, and 0.0231 BTC (.5 Fibonacci Retracement).
The RSI has also marginally dipped beneath the 50 level as the sellers start to gain possession over the market momentum. If it continues to fall, we can expect the selling to continue within ETH/BTC.
Similarly, the Stochastic RSI is in oversold conditions, and a bullish crossover signal will be the first sign that the selling may be coming to a close.