Yuval Gov
November 24, 2019
Bitcoin (BTC), Crypto news, Markets
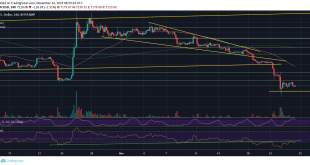
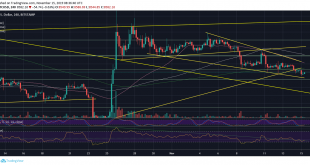
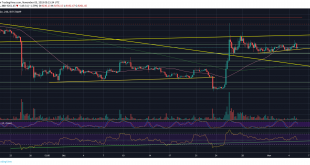
The recent week was not the best for Bitcoin’s price, which lost almost 20% in just seven days.The bad thing is that it’s still hard to see the end of those severe declines. However, if you look for a positive sign, you can find it in the fact that yesterday’s daily candle finished green, for the first time following five ugly red candles.Looking at the following daily chart, we can see a secure area of support around $6800 – $7000. After dropping to those levels during last Friday, Bitcoin...
Read More »
Yuval Gov
November 22, 2019
Bitcoin (BTC), Crypto news, Markets
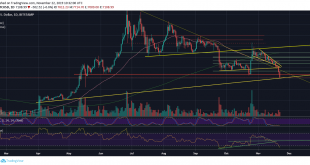
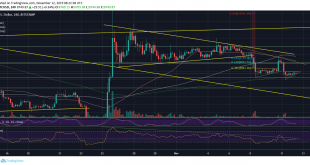
Just yesterday, we had celebrated the goodbye party from the $8000 price level, which held Bitcoin for the past couple of days.Yesterday’s bloody price action ended up in a retest of the significant support area of $7400. The last was the lowest price level of BTC before the vast 42% price surge, which took place on October 26, and ended up touching $10,350.It’s not even a month later, and Bitcoin is down again, no recognition of the October 26 impressive price surge. Bitcoin is now...
Read More »
Yuval Gov
November 21, 2019
Bitcoin (BTC), Crypto news, Markets
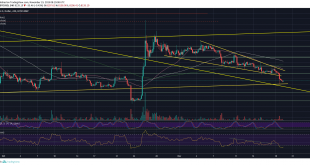
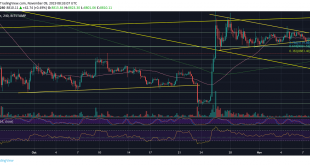
Since the massive price drop at the beginning of this week, and for the past three days, Bitcoin is trading a little above the $8000 support area.This $8000 support line is getting its strength from the 78.6% Fibonacci level, along with the mid-term ascending trend-line and the historic price support area of $8000.From the bullish perspective, the fact that the $8K support had held for the last three days might become a ground for a positive correction; however, the bulls anticipating that...
Read More »
Yuval Gov
November 19, 2019
Bitcoin (BTC), Crypto news, Markets
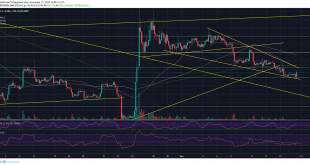
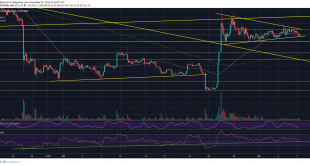
On our recent price analysis, we had discussed the colossal move that was coming up, which should have been the breakout of the wedge pattern that Bitcoin had gone through over the past three weeks.Unfortunately, if you ask the Bulls, Bitcoin broke down violently: The coin had lost $500 from its price on the daily, marking $8010 as its yesterday’s low (Bitstamp).We anticipated this violent move and stated that “if Bitcoin breaks down the wedge around the $8400 support, there is likely to be a...
Read More »
Yuval Gov
November 17, 2019
Bitcoin (BTC), Crypto news, Markets
Over the past week, we didn’t see much volatility on behalf of Bitcoin; However, the cryptocurrency’s price was slowly losing momentum from day-to-day.The current weekly low is approximately the crucial support level of $8400. This was recorded twice – this morning and two days ago. It is not a coincidence, as this is also the ‘bottom’ of the bull falling wedge pattern Bitcoin had built throughout the past two weeks or so.The apex of this wedge is expected to take place around November 21,...
Read More »
Yuval Gov
November 15, 2019
Markets
Since our previous analysis, Bitcoin was mainly ‘stuck’ trading between the range of $8600 – $8700. We had mentioned the possibility of a bullish breakout; However, the breakout did take place, but quickly turned into a fake-out upon reaching $8800.Overall, despite the lower highs trajectory, which is a bearish pattern, we can see that Bitcoin is forming a bull flag, and this is still intact (till proven otherwise). Besides, the $8500 area is the Golden Fibonacci level of 61.8% from the vast...
Read More »
Yuval Gov
November 12, 2019
Bitcoin (BTC), Crypto news, Markets
Over the past days, we saw the Bitcoin price decreasing slowly, but staying steady around the $8700 – $8800 price range.Ignoring the “Bart” pattern price manipulation over the weekend, Bitcoin had been trading at the mentioned range over the past four days.On our recent Bitcoin price analysis, we had mentioned precisely where the positive correction could reach out: “In my opinion, the correction can also reach $9000 – $9100 (Fibonacci levels 61.8% and 78.6%).”As could be seen, the $9150 was...
Read More »
Yuval Gov
November 9, 2019
Bitcoin (BTC), Crypto news, Markets
Just a quick weekend update for Bitcoin price following the break-down of the triangle we had pointed out two days ago, along with the significant key-support area of the 200-days moving average line.Two days ago, I warned here that Bitcoin is at short-term risk. As can be seen, Bitcoin didn’t hold support for the fifth time, and violently broke down. This resulted in a 48-hours $800 drop. On the following charts, you can see the moment BTC broke down roughly at $9150, followed by substantial...
Read More »
Yuval Gov
November 7, 2019
Bitcoin (BTC), Crypto news, Ethereum (ETH), Markets
For the past ten days, Bitcoin is trading inside a tight range, which is very unlikely for the primary cryptocurrency.We can almost say that the past week was boring for the heavy crypto traders. However, this stability could come up to an end very shortly.Looking on the following 4-hour chart, we can see that Bitcoin is forming a symmetrical triangle with a Bullish bias, from the fact that it can turn into a bull flag very quickly (in the case of a breakup).Despite the above said, since...
Read More »
Yuval Gov
November 5, 2019
Bitcoin (BTC), Crypto news, Markets
Over the past days, Bitcoin had been moving sideways between $9000 and $9500. This price range had been following the recent Bitcoin price action since for the past ten days, since the vast price surge on October 26.At the macro level, it seems like nothing is progressing, as Bitcoin still awaits its next major move.On the never-ending fight between the Bulls and the Bears, it seems like the bulls are in control. Probably, the most reliable sign is the 200-days moving average line (MA-200):...
Read More »