Over the past days, Bitcoin had been moving sideways between 00 and 00. This price range had been following the recent Bitcoin price action since for the past ten days, since the vast price surge on October 26.At the macro level, it seems like nothing is progressing, as Bitcoin still awaits its next major move.On the never-ending fight between the Bulls and the Bears, it seems like the bulls are in control. Probably, the most reliable sign is the 200-days moving average line (MA-200): Since breaking it up during the Bullish prior weekend, Bitcoin had been testing it for four times. Any retest of the line had ended up with a daily candle’s wick and reversal back up of the Bitcoin’s price. So far, so good, steady but fragile.At the micro-level, we can see the indecisive state that
Topics:
Yuval Gov considers the following as important: BTCanalysis
This could be interesting, too:
Yuval Gov writes Bitcoin Price Analysis: BTC Struggles To Maintain Critical Support Level, Drop To 00 Very Soon?
Yuval Gov writes Bitcoin Completes 3-Day 00 Plunge: Where Is The Bottom? Price Analysis & Weekly Overview
Yuval Gov writes Bitcoin Price Analysis: After 0 Plunge In 48 Hours, Bitcoin Is Facing Huge Critical Support Area
Yuval Gov writes Bitcoin Price Analysis: Following Decent 0 Surge – Is Bitcoin Ready To Conquer ,000 Again, Or Just A Temp Correction?
Over the past days, Bitcoin had been moving sideways between $9000 and $9500. This price range had been following the recent Bitcoin price action since for the past ten days, since the vast price surge on October 26.
At the macro level, it seems like nothing is progressing, as Bitcoin still awaits its next major move.
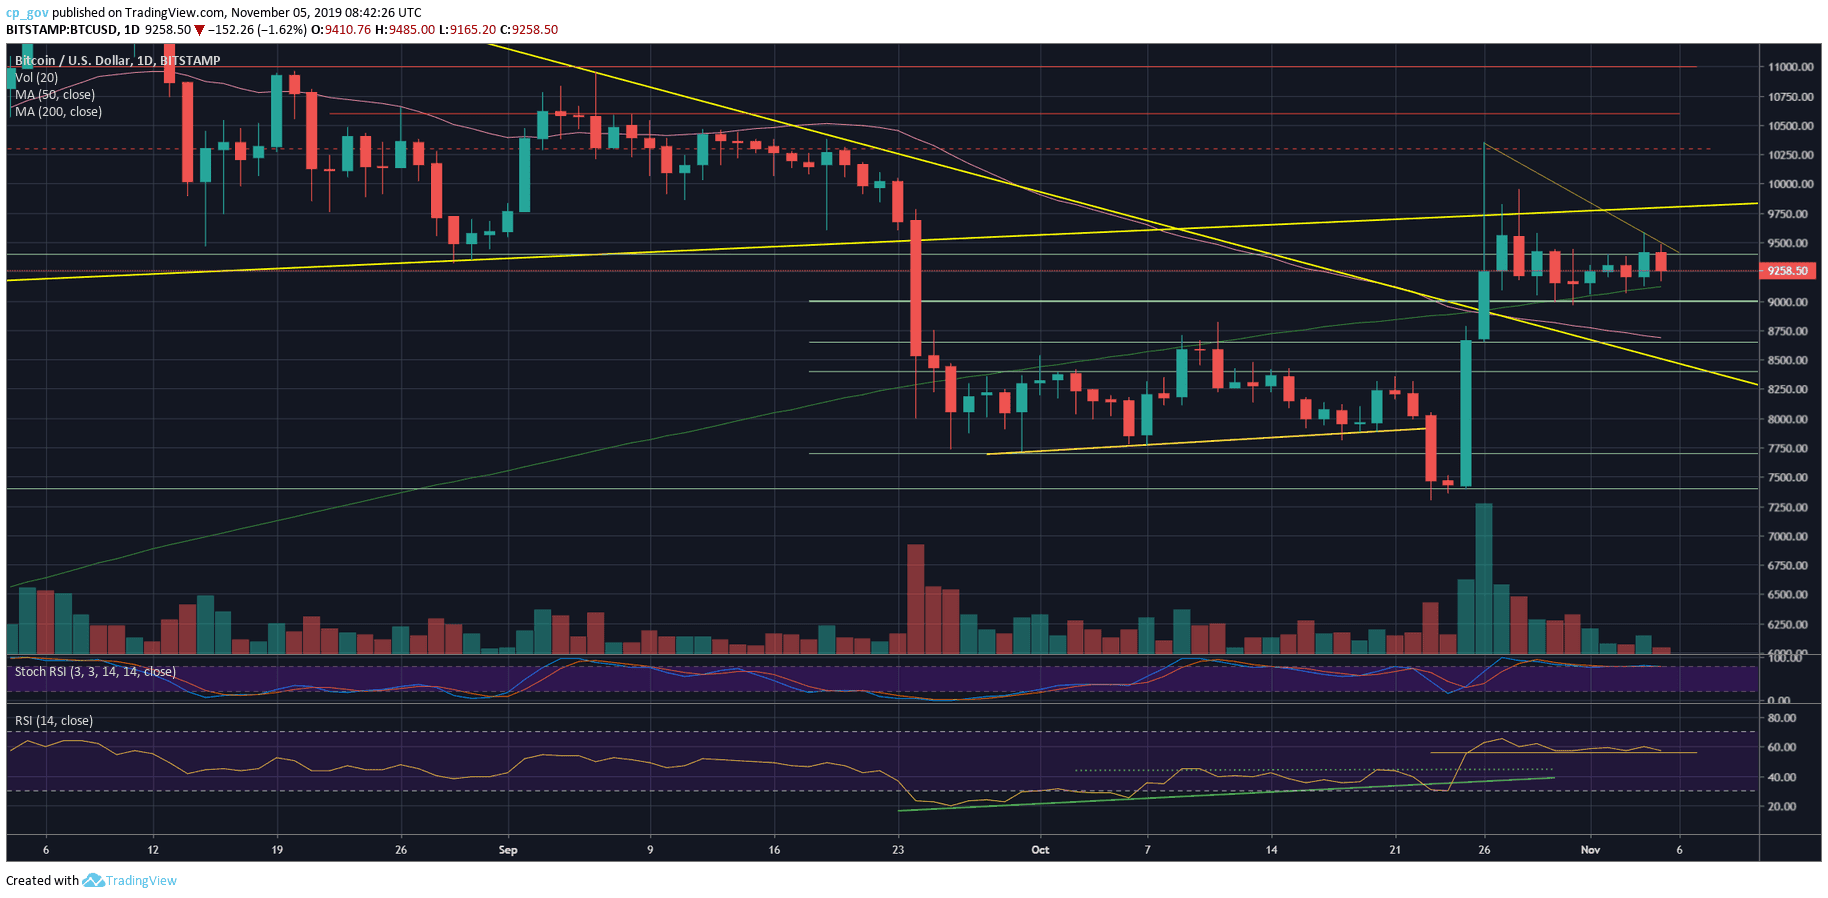
On the never-ending fight between the Bulls and the Bears, it seems like the bulls are in control. Probably, the most reliable sign is the 200-days moving average line (MA-200): Since breaking it up during the Bullish prior weekend, Bitcoin had been testing it for four times. Any retest of the line had ended up with a daily candle’s wick and reversal back up of the Bitcoin’s price. So far, so good, steady but fragile.
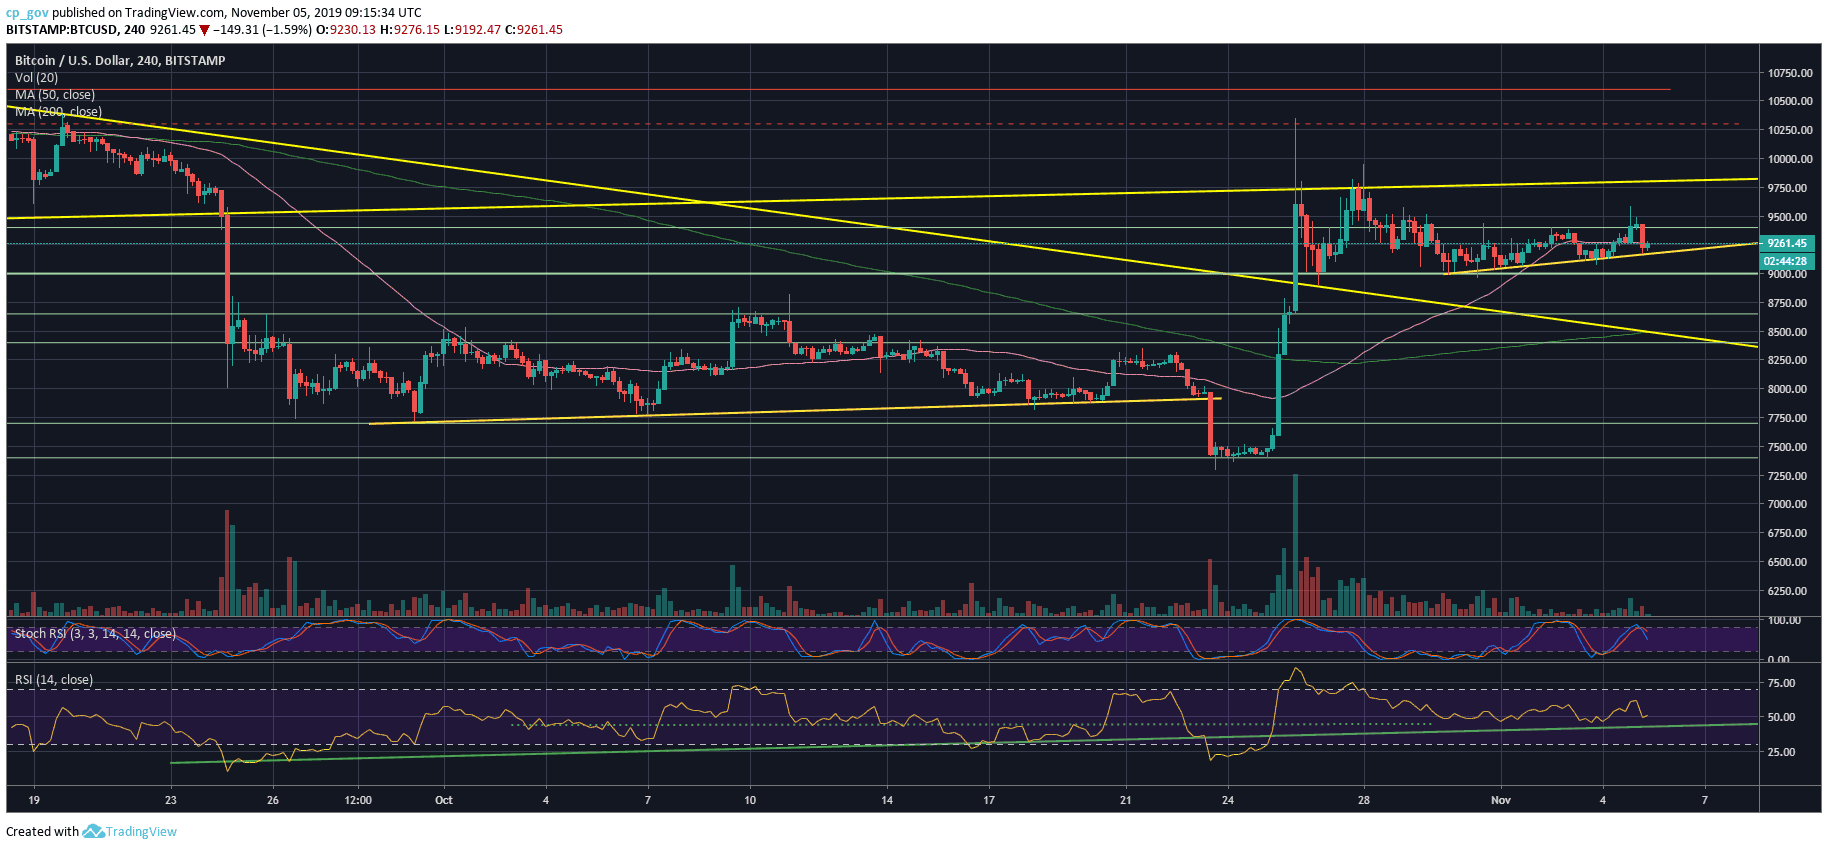
At the micro-level, we can see the indecisive state that Bitcoin is moving through. On the following 4-hour chart, we can identify a decent green candle from 12 hours ago with a long wick above as Bitcoin was retesting resistance at $9600 but quickly got rejected. As of writing this, Bitcoin is back to its recent weekly averages, around $9200.
Despite the price action, the trading volume is still minor compared to the monthly highs. The daily RSI is still steady above the 56 levels, anticipating the next significant move. The only thing that might concern the bulls is the Stochastic RSI oscillator on the daily timeframe. Following a bearish crossover in the overbought territory, the oscillator is about to enter the correction zone.
Total Market Cap: $249.4 billion
Bitcoin Market Cap: $167.5 billion
BTC Dominance Index: 67.1%
*Data by CoinGecko
Key Levels to Watch
– Support/Resistance: From below, the first level of support is the nearby $9200 price level. Right below lies the 200-days moving average line – currently around $9,120, as mentioned above. The next level of support is $9000, before the $8800 support area.
From above, Bitcoin is still facing the resistance area of $9400 – $9500 like it did throughout the past week. In case of a breakup, we should see Bitcoin reaching quickly to $9800 – $10,000 zone. Further resistance lies at $10,300 – $10,400.
BTC/USD BitStamp 4-Hour Chart
BTC/USD BitStamp 1-Day Chart