Over the past week, we didn’t see much volatility on behalf of Bitcoin; However, the cryptocurrency’s price was slowly losing momentum from day-to-day.The current weekly low is approximately the crucial support level of 00. This was recorded twice – this morning and two days ago. It is not a coincidence, as this is also the ‘bottom’ of the bull falling wedge pattern Bitcoin had built throughout the past two weeks or so.The apex of this wedge is expected to take place around November 21, which is this coming up Thursday. However, Bitcoin tends not to wait for the apex in order to make a breakout. Either way, we are expecting to see a little more volatility this coming week.Despite that the described wedge pattern is bullish, anything can happen since the breakout is possible in both
Topics:
Yuval Gov considers the following as important: bitcoin price, BTC, BTCanalysis
This could be interesting, too:
Christian Mäder writes Bitcoin-Transaktionsgebühren auf historischem Tief: Warum jetzt der beste Zeitpunkt für günstige Überweisungen ist
Christian Mäder writes Das Bitcoin-Reserve-Rennen der US-Bundesstaaten: Wer gewinnt das Krypto-Wettrüsten?
Emily John writes Metaplanet Expands Bitcoin Holdings with .4M BTC Purchase
Christian Mäder writes Die besten Bitcoin-Visualisierungen: Ein Blick auf Preisentwicklung, Blockchain und Netzwerk
Over the past week, we didn’t see much volatility on behalf of Bitcoin; However, the cryptocurrency’s price was slowly losing momentum from day-to-day.
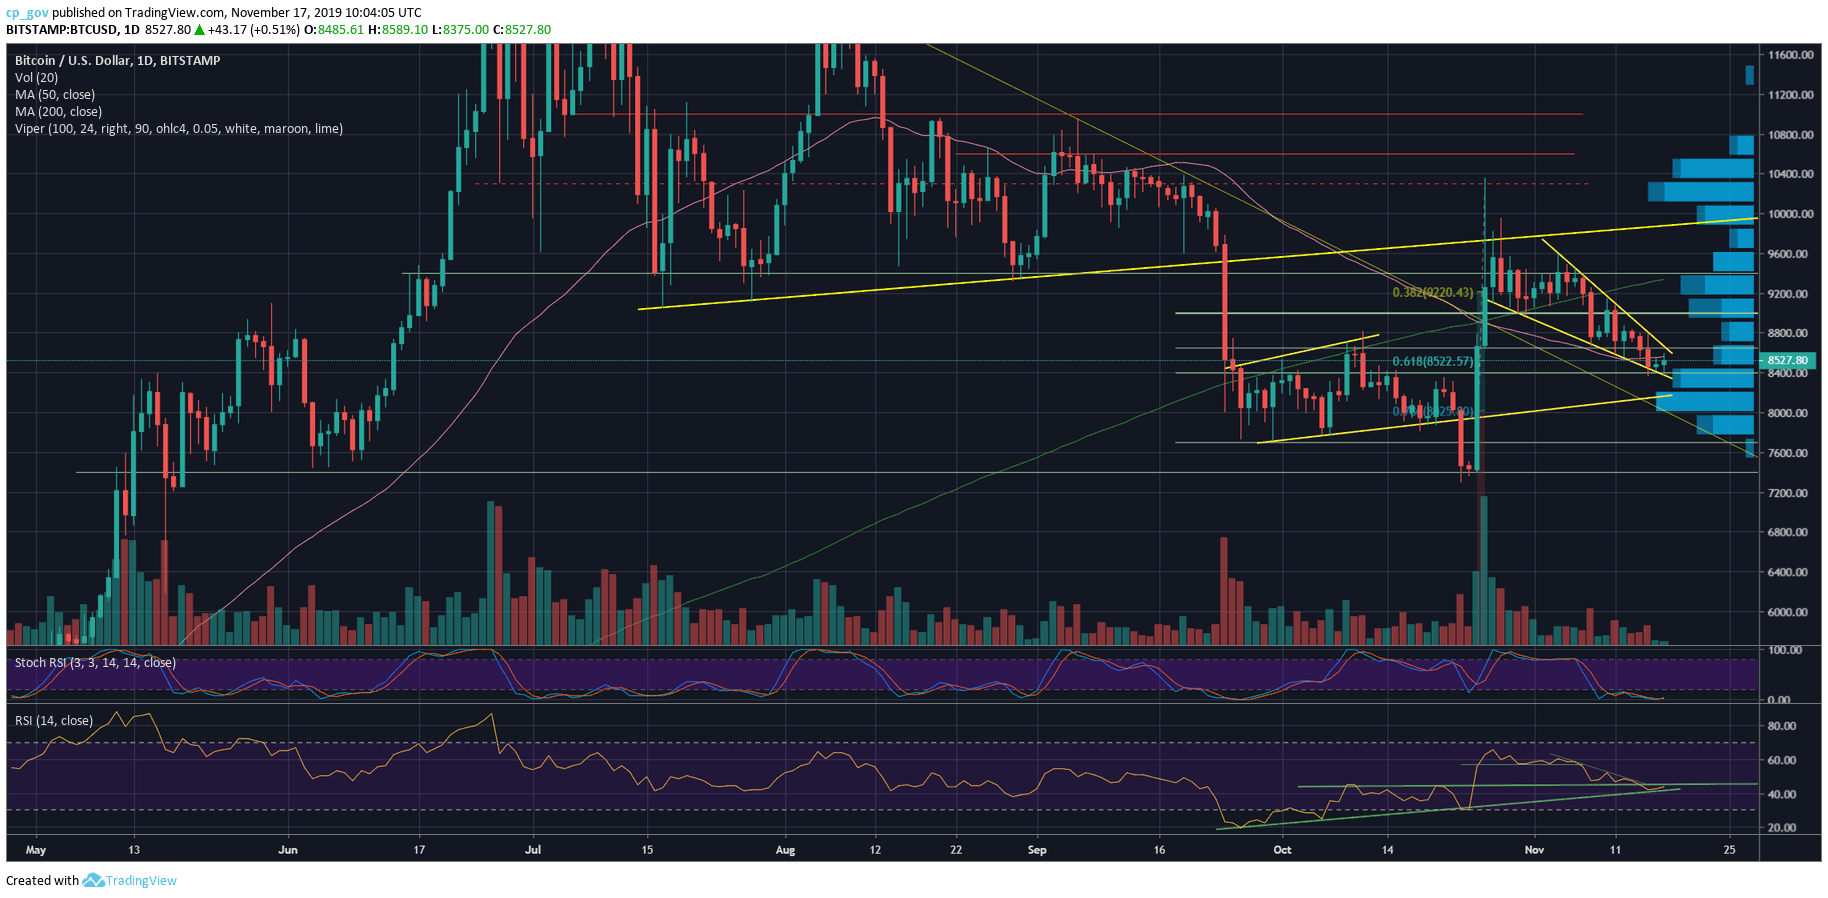
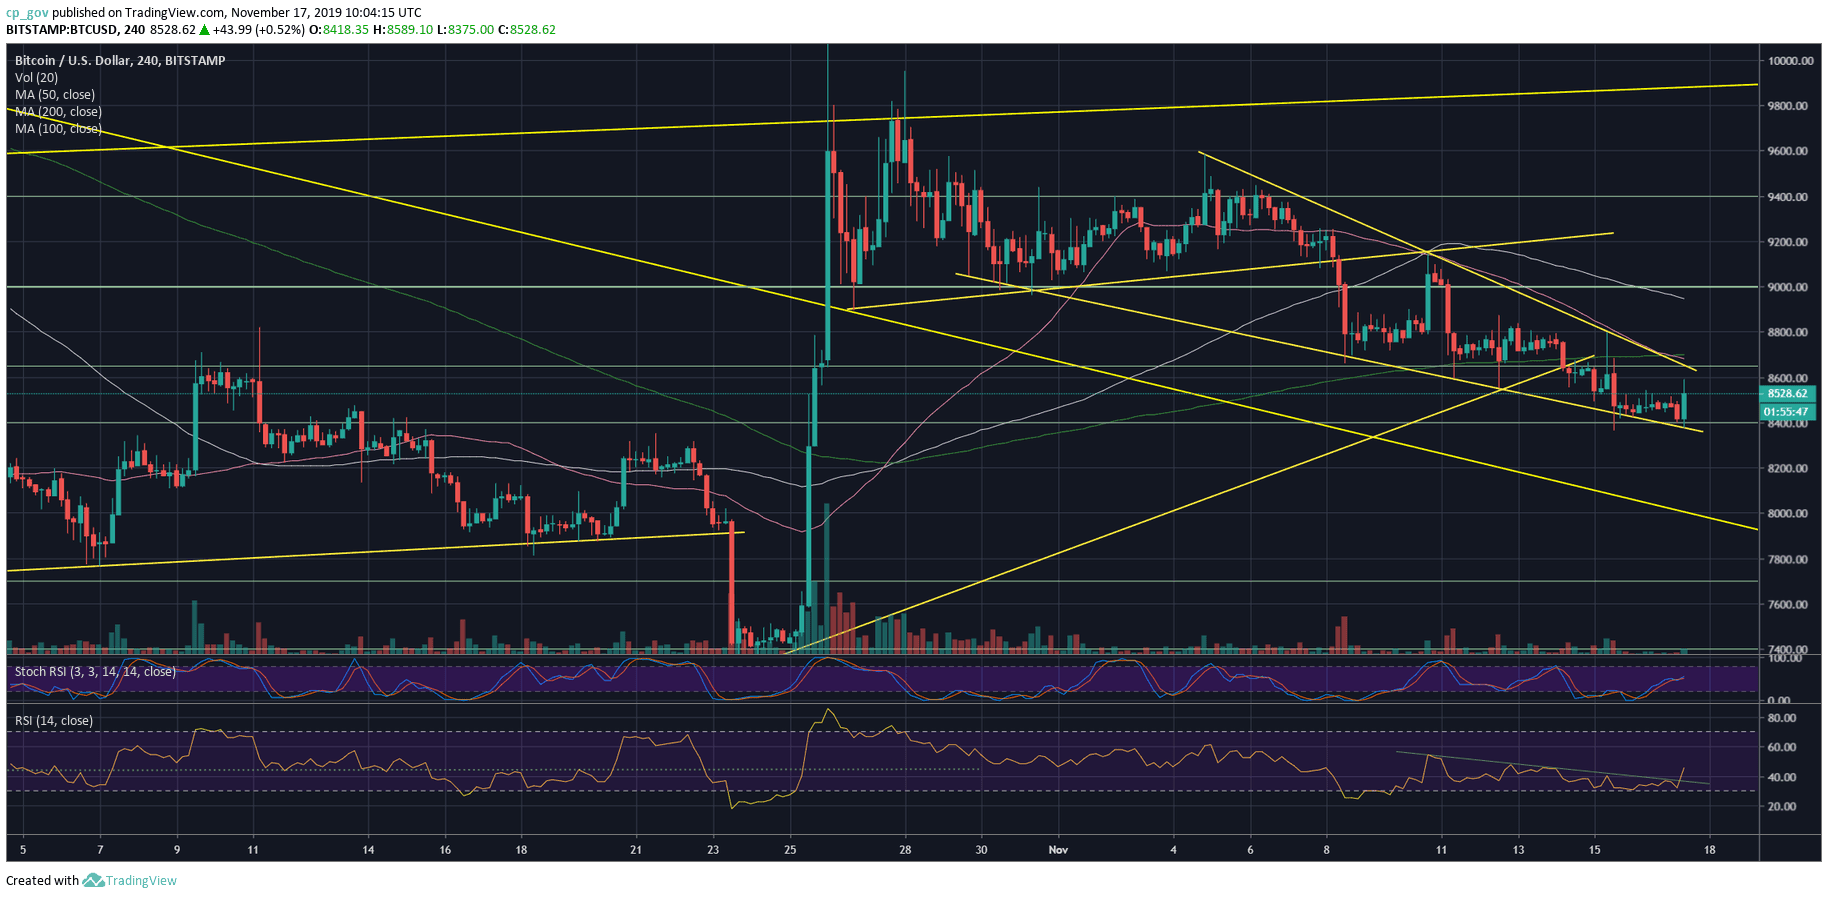
The current weekly low is approximately the crucial support level of $8400. This was recorded twice – this morning and two days ago. It is not a coincidence, as this is also the ‘bottom’ of the bull falling wedge pattern Bitcoin had built throughout the past two weeks or so.
The apex of this wedge is expected to take place around November 21, which is this coming up Thursday. However, Bitcoin tends not to wait for the apex in order to make a breakout. Either way, we are expecting to see a little more volatility this coming week.
Despite that the described wedge pattern is bullish, anything can happen since the breakout is possible in both directions, and the price range is very tight. We should see some fight between the bears and the bulls until a decision is made, keeping in mind that there could be fakeouts
Total Market Cap: $235 billion
Bitcoin Market Cap: $154.8 billion
BTC Dominance Index: 66.0%
*Data by CoinGecko
Key Levels to Watch
– Support/Resistance: The nearby support lies around $8400, which is so far holding up (a double-bottom, which has a bullish bias). As mentioned, this is also the lower angle of the wedge, so in case of a breakdown, we should expect a quick move to the bearish side. The possible next support lies at $8200 (along with mid-term descending trend line), followed by the $8000 benchmark. Both levels have a lot of demand (looking on the VpVr indicator – the blue horizontal lines on the right side of the daily chart).
From above, the first level of resistance lies at $8600 – $8650, which is the upper side of the falling wedge. A breakout and Bitcoin should be seeing the next resistance levels at $8800 – $9000 quickly.
– The RSI Indicator: After finding possible support on the long term ascending trend-line, The daily RSI had turned around, but now facing the 44 – 45 level as strong resistance.
– Trading volume: The volume is declining over the past three weeks. This is aligned with the anticipation of a coming up-move later this week.
BTC/USD BitStamp 4-Hour Chart
BTC/USD BitStamp 1-Day Chart