Since our previous analysis, Bitcoin was mainly ‘stuck’ trading between the range of 00 – 00. We had mentioned the possibility of a bullish breakout; However, the breakout did take place, but quickly turned into a fake-out upon reaching 00.Overall, despite the lower highs trajectory, which is a bearish pattern, we can see that Bitcoin is forming a bull flag, and this is still intact (till proven otherwise). Besides, the 00 area is the Golden Fibonacci level of 61.8% from the vast 42% surge on October 26.The last level, along with support at 00, might be serving as a substantial support area, at least for the short-term.Keeping in mind the above, we’re expecting a breakout to either direction over the coming days, and the fact that a weekend is nearby is not a coincidence
Topics:
Yuval Gov considers the following as important: BTCanalysis
This could be interesting, too:
Yuval Gov writes Bitcoin Price Analysis: BTC Struggles To Maintain Critical Support Level, Drop To 00 Very Soon?
Yuval Gov writes Bitcoin Completes 3-Day 00 Plunge: Where Is The Bottom? Price Analysis & Weekly Overview
Yuval Gov writes Bitcoin Price Analysis: After 0 Plunge In 48 Hours, Bitcoin Is Facing Huge Critical Support Area
Yuval Gov writes Bitcoin Price Analysis: Following Decent 0 Surge – Is Bitcoin Ready To Conquer ,000 Again, Or Just A Temp Correction?
Since our previous analysis, Bitcoin was mainly ‘stuck’ trading between the range of $8600 – $8700. We had mentioned the possibility of a bullish breakout; However, the breakout did take place, but quickly turned into a fake-out upon reaching $8800.
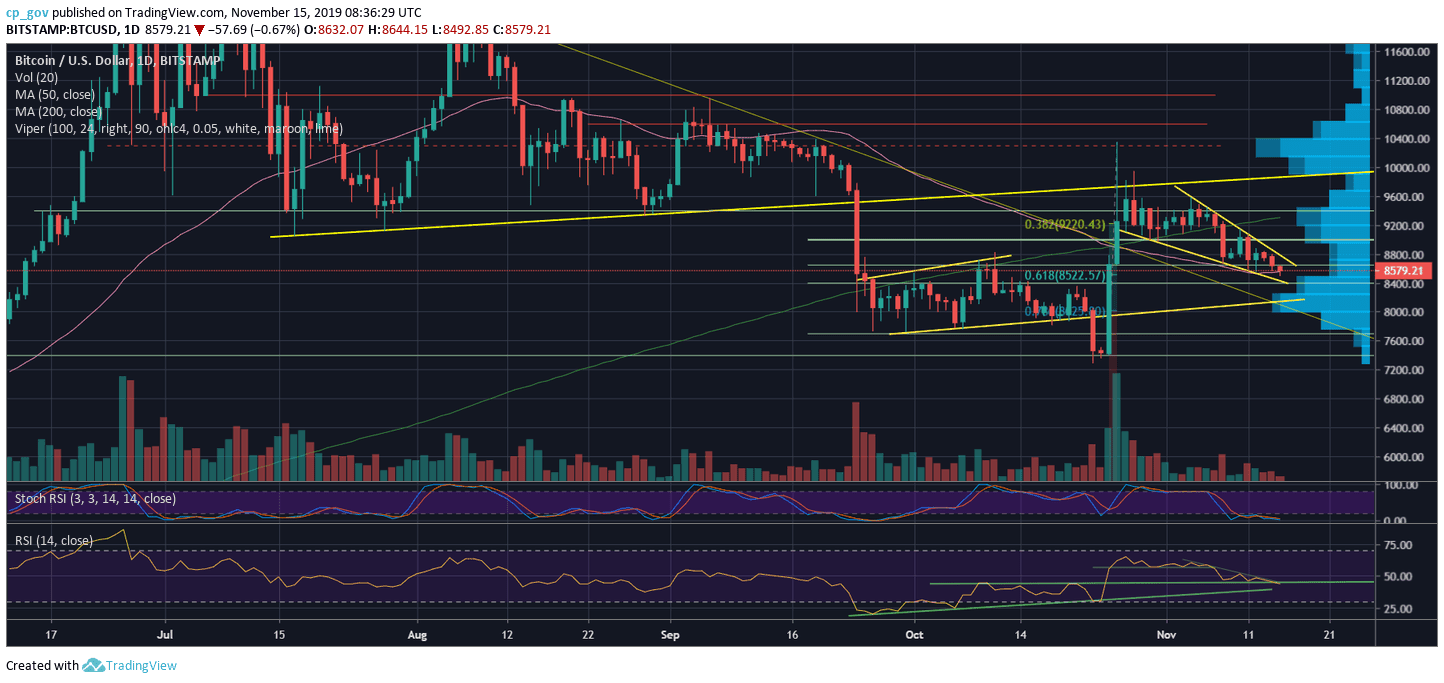
Overall, despite the lower highs trajectory, which is a bearish pattern, we can see that Bitcoin is forming a bull flag, and this is still intact (till proven otherwise). Besides, the $8500 area is the Golden Fibonacci level of 61.8% from the vast 42% surge on October 26.
The last level, along with support at $8400, might be serving as a substantial support area, at least for the short-term.
Keeping in mind the above, we’re expecting a breakout to either direction over the coming days, and the fact that a weekend is nearby is not a coincidence since Bitcoin loves producing price moves during weekends.
Total Market Cap: $236.7 billion
Bitcoin Market Cap: $155.8 billion
BTC Dominance Index: 65.8%
*Data by CoinGecko
Key Levels to Watch
– Support/Resistance: The first level of support is today’s low around $8500, along with the mentioned Golden Fib level. The bull flag formation’s lower angle is around $8430; hence, the $8400 horizontal support can also be kept in mind here.
Further below is $8200 before reaching the good old $8000 support area. A break below $8400 is likely to ignite a quick bearish move back to $8K.
From above, the first level of resistance is the support turned resistance area of $8650 – $8700. Little above lies the $8800 level, which is currently where the bull flag’s upper boundary lies. Further above is the area of $9000 – $9150, which is the past week’s high.
The significant 200-days moving average line is getting further – hovering around $9320 as of writing this. In my opinion, the level of $9300- $9400 is the critical mid-term level.
The RSI Indicator: The daily RSI is barely holding the 44-support level. However, anything is possible from here, as the RSI needs to take a decision.
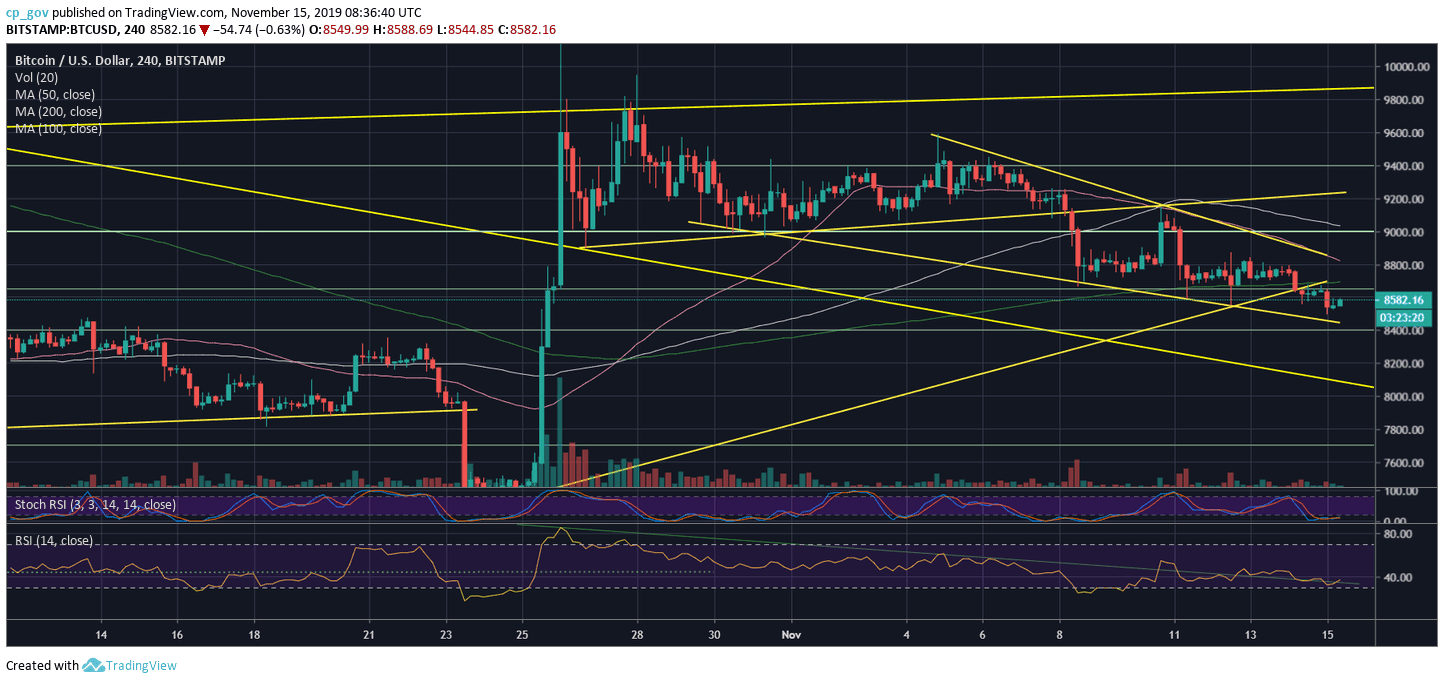
Both the 4-hour and the daily chart are in their oversold territory, as can be concluded by looking at the Stochastic RSI oscillator. This can turn bullish and fuel the next price rise, in case of a bullish cross over.
Trading volume: Despite the recent price drop, the volume is far from being significant.
BTC/USD BitStamp 4-Hour Chart
BTC/USD BitStamp 1-Day Chart