Over the past two days, the volatility surrounding the price of Bitcoin had calmed down a bit.Despite a little glitch to the downside, Bitcoin (BTC) is trading between 00 and 00 over the past 48 hours.The good news could be the formation of an inverse head and shoulders pattern, that if played out, can grant Bitcoin a decent short-term target around 00.The pattern can be clearly seen on the following 4-hour chart, and it will play out in the case of a breakout of the 00 neckline in the next several hours, and it needs to be followed by a reasonable amount of trading volume.On the macro level, as seen on the following daily chart, we can see that the significant mid-term ascending trendline, which started forming in April 2019, still holds the price nicely.Total Market Cap:
Topics:
Yuval Gov considers the following as important: Bitcoin Prediction, bitcoin price, BTC, BTCanalysis
This could be interesting, too:
Christian Mäder writes Bitcoin-Transaktionsgebühren auf historischem Tief: Warum jetzt der beste Zeitpunkt für günstige Überweisungen ist
Christian Mäder writes Das Bitcoin-Reserve-Rennen der US-Bundesstaaten: Wer gewinnt das Krypto-Wettrüsten?
Emily John writes Metaplanet Expands Bitcoin Holdings with .4M BTC Purchase
Christian Mäder writes Die besten Bitcoin-Visualisierungen: Ein Blick auf Preisentwicklung, Blockchain und Netzwerk
Over the past two days, the volatility surrounding the price of Bitcoin had calmed down a bit.
Despite a little glitch to the downside, Bitcoin (BTC) is trading between $7000 and $7400 over the past 48 hours.
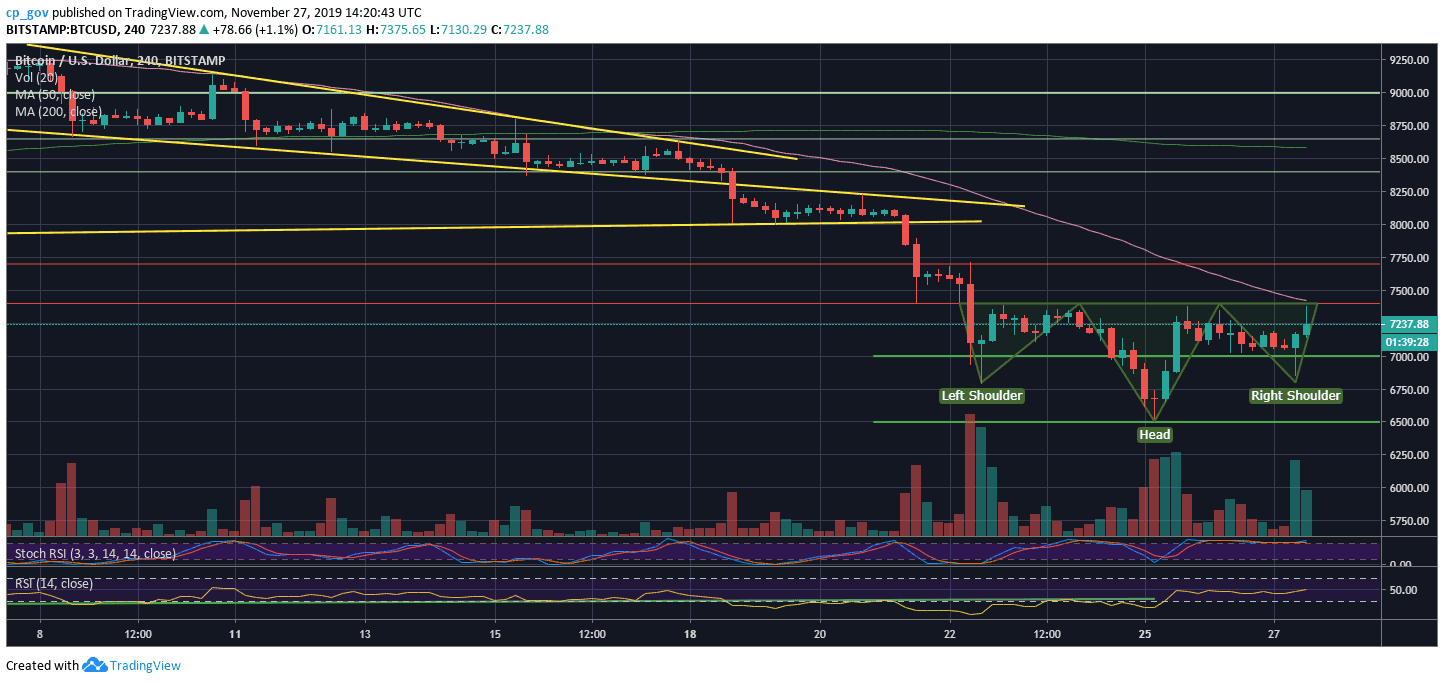
The good news could be the formation of an inverse head and shoulders pattern, that if played out, can grant Bitcoin a decent short-term target around $8300.
The pattern can be clearly seen on the following 4-hour chart, and it will play out in the case of a breakout of the $7400 neckline in the next several hours, and it needs to be followed by a reasonable amount of trading volume.
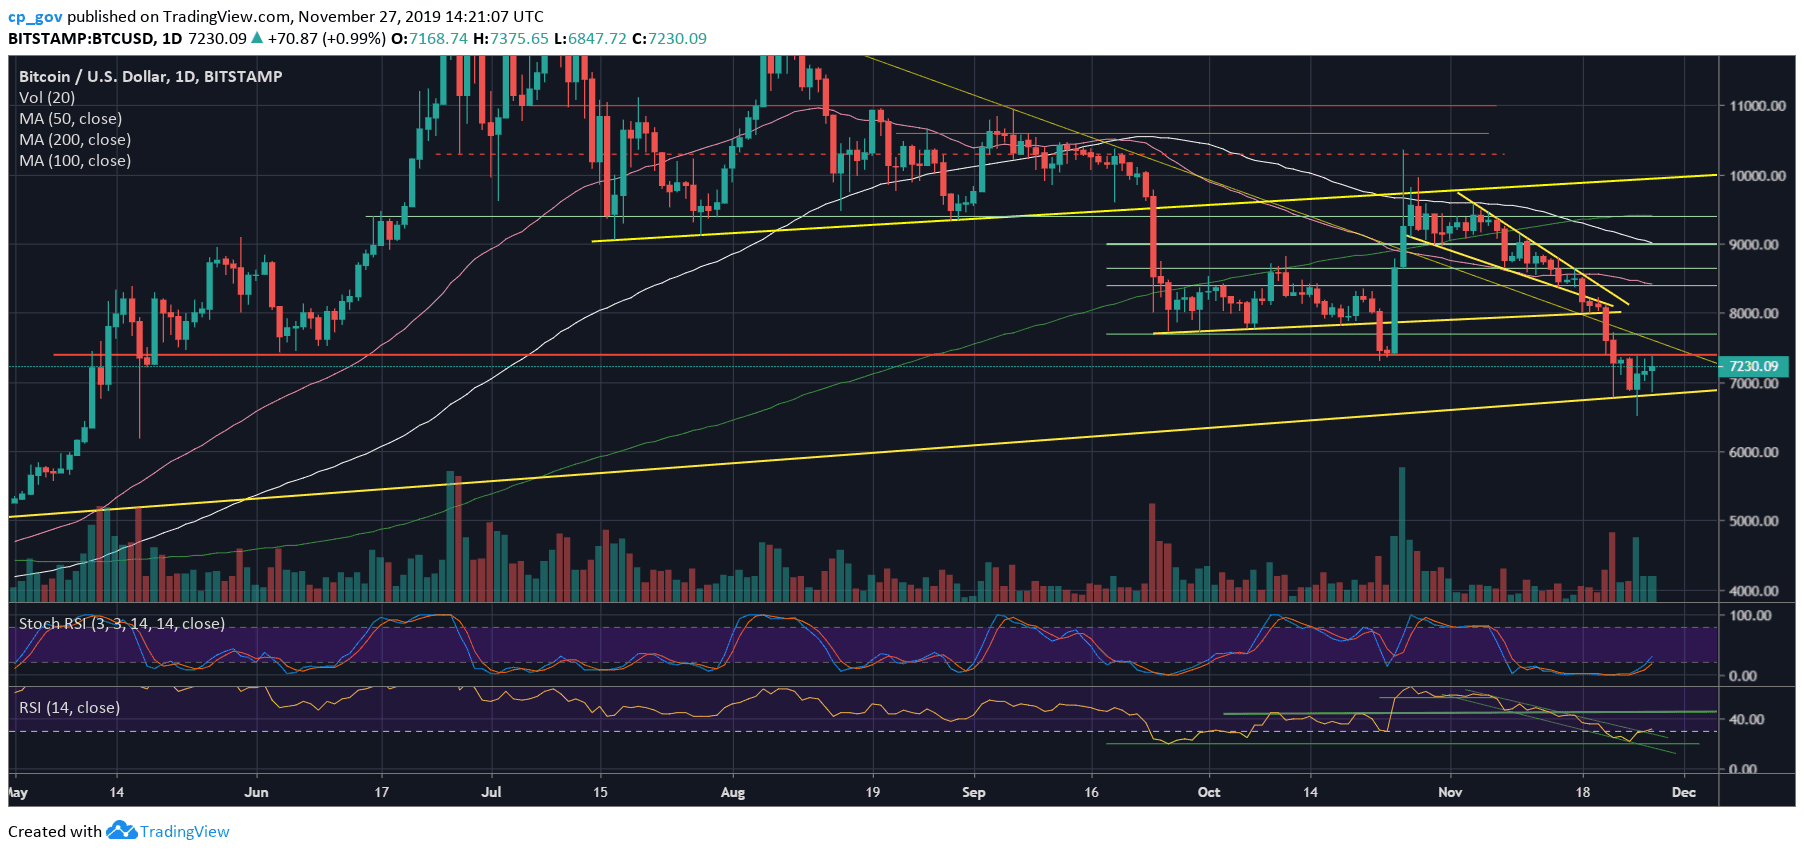
On the macro level, as seen on the following daily chart, we can see that the significant mid-term ascending trendline, which started forming in April 2019, still holds the price nicely.
Total Market Cap: $198.5 billion
Bitcoin Market Cap: $131.6 billion
BTC Dominance Index: 66.4%
*Data by CoinGecko
Key Levels to Watch
– Support/Resistance: As mentioned above, Bitcoin is now facing the significant $7300 – $7400 resistance area, which was a clear boundary for Bitcoin over the past five days. In case of a break-up, the next resistance lies at $7700. In order for Bitcoin to return to the bullish track, it will need to at least get over the $8000 benchmark and confirm it as support by creating a higher-low. The above-described inverse head and shoulders’ target is above $8000.
From below, $7000 is now the first line of support. In case Bitcoin goes lower, then $6800 is the next support level (the “right shoulder” that supported Bitcoin this morning), along with the significant ascending trend-line (as mentioned above). Further below is $6500, which is the weekly low.
Further down lies $6000 – $6200, that should serve as a secure demand zone, in case Bitcoin gets there
– The RSI Indicator: The RSI is at a crucial area, starting to break-out from the descending channel (as can be seen on the daily chart), which can turn into a bullish sign.
The stochastic RSI oscillator that recently produced a bullish cross-over is just about entering the neutral territory. This may also lead to a bullish break-up of the $7400 resistance.
– Trading volume: Following the huge sell-off candle from Friday, the bulls produced their own decent green volume candle from the last Monday. This is another sign that the price area is a “war zone” between the bulls and the bears.
BTC/USD BitStamp 4-Hour Chart
BTC/USD BitStamp 1-Day Chart