Our previous price analysis had identified a tight range in which Bitcoin is trading inside. Over the past hours, this range is seemingly cracking down, to the downside.For the past five days, Bitcoin was trading between 00 to 00. Despite a fake-out that reached the mentioned resistance area of 00, Bitcoin was trading inside a descending channel, which can be seen on the following 4-hour chart.Adding negative indication coming on behalf of the Relative Strength Index (the RSI), as of now, it looks like Bitcoin would like to retest the 00 area once again.Total Market Cap: 8 billionBitcoin Market Cap: 2.3 billionBTC Dominance Index: 66.8%*Data by CoinGeckoKey Levels to Watch– Support/Resistance: As of writing this, Bitcoin had recently marked 50 as the current daily low.
Topics:
Yuval Gov considers the following as important: BTCanalysis
This could be interesting, too:
Yuval Gov writes Bitcoin Price Analysis: BTC Struggles To Maintain Critical Support Level, Drop To 00 Very Soon?
Yuval Gov writes Bitcoin Completes 3-Day 00 Plunge: Where Is The Bottom? Price Analysis & Weekly Overview
Yuval Gov writes Bitcoin Price Analysis: After 0 Plunge In 48 Hours, Bitcoin Is Facing Huge Critical Support Area
Yuval Gov writes Bitcoin Price Analysis: Following Decent 0 Surge – Is Bitcoin Ready To Conquer ,000 Again, Or Just A Temp Correction?
Our previous price analysis had identified a tight range in which Bitcoin is trading inside. Over the past hours, this range is seemingly cracking down, to the downside.
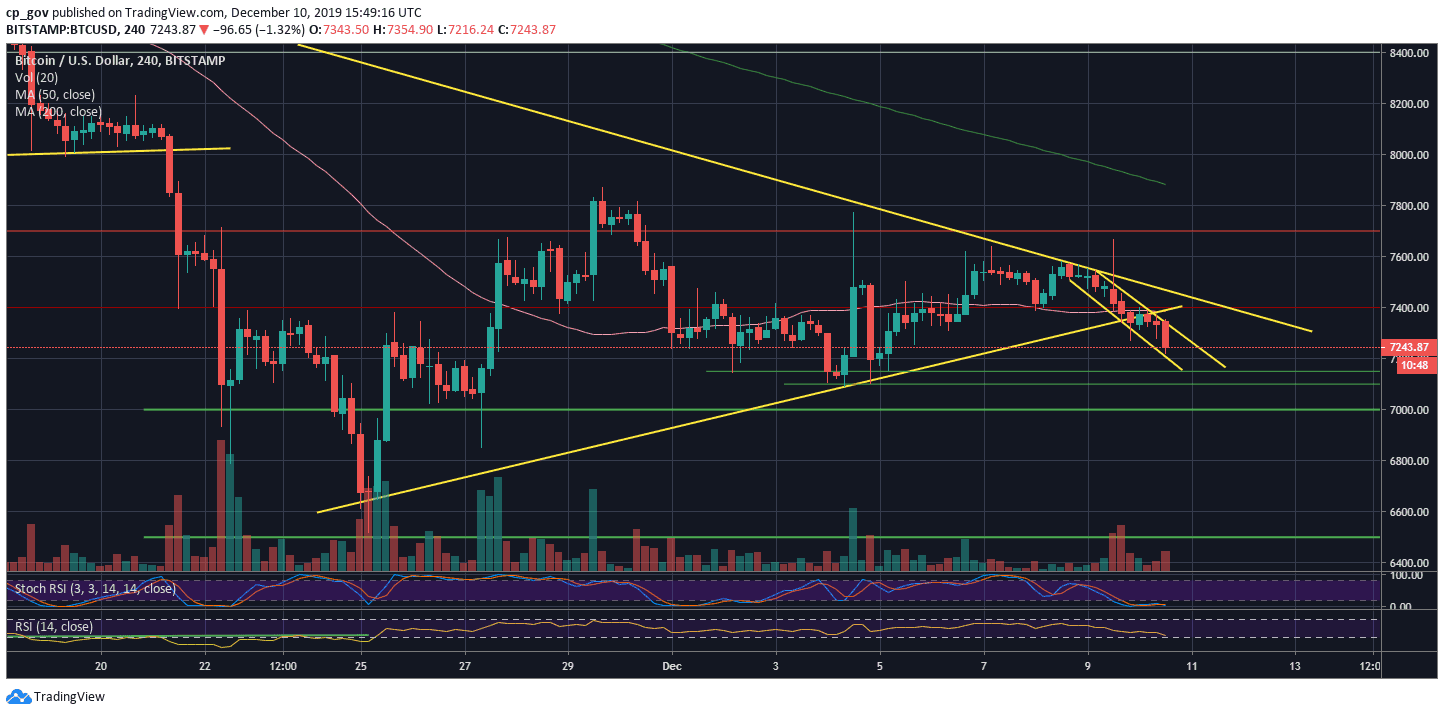
For the past five days, Bitcoin was trading between $7300 to $7600. Despite a fake-out that reached the mentioned resistance area of $7700, Bitcoin was trading inside a descending channel, which can be seen on the following 4-hour chart.
Adding negative indication coming on behalf of the Relative Strength Index (the RSI), as of now, it looks like Bitcoin would like to retest the $7000 area once again.
Total Market Cap: $198 billion
Bitcoin Market Cap: $132.3 billion
BTC Dominance Index: 66.8%
*Data by CoinGecko
Key Levels to Watch
– Support/Resistance: As of writing this, Bitcoin had recently marked $7250 as the current daily low. Further below lies $7150 support (weak), $7100, and $7000 support. The last includes a critical ascending trend-line (marked on the daily chart), which started forming since April 2019.
Further down is the $6800 horizontal support, before the $6500 area, which is Bitcoin’s 6-month low.
In the case of a correction, the first resistance is the 4-hour marked descending channel. A little above lies the $7400 resistance, along with the mid-term descending trend-line. Further above lies the $7700 – $7800 horizontal resistance.
– The RSI Indicator: In our previous analysis, we had identified the 45 RSI level as a crucial resistance. Unfortunate to the Bulls, Bitcoin failed in breaching it, and over the past two days, the RSI is declining and losing momentum, in correlation with the price.
– Trading volume: Following low-volume days, Bitcoin finally has seen some price action. However, this is far from reaching near the top volume days of the past month.
BTC/USD BitStamp 4-Hour Chart
BTC/USD BitStamp 1-Day Chart
