In our recent price analysis, we had anticipated a huge move coming up very soon. We couldn’t predict to which direction.The result was a massive 0 move to the upside, followed by an opposite move to the downside, to exactly where the movement began from (roughly 00). And the winner is? Of course, the exchanges that allow margin trading, who encourage trading volumes.The bottom line is that Bitcoin stays at the same price level, the same confluence price zone, between 00 – 00, which has a lot of supply and demand in it. The bears and the bulls are fighting over that region, and the war is going on as I’m writing these lines.As of now, the market looks neutral with a bearish bias, due to the mid-term trend. Today, Bitcoin is entering the final day of the week, whereas the
Topics:
Yuval Gov considers the following as important: Bitcoin Prediction, bitcoin price, BTC, BTCanalysis
This could be interesting, too:
Christian Mäder writes Bitcoin-Transaktionsgebühren auf historischem Tief: Warum jetzt der beste Zeitpunkt für günstige Überweisungen ist
Christian Mäder writes Das Bitcoin-Reserve-Rennen der US-Bundesstaaten: Wer gewinnt das Krypto-Wettrüsten?
Emily John writes Metaplanet Expands Bitcoin Holdings with .4M BTC Purchase
Christian Mäder writes Die besten Bitcoin-Visualisierungen: Ein Blick auf Preisentwicklung, Blockchain und Netzwerk
In our recent price analysis, we had anticipated a huge move coming up very soon. We couldn’t predict to which direction.
The result was a massive $800 move to the upside, followed by an opposite move to the downside, to exactly where the movement began from (roughly $7100). And the winner is? Of course, the exchanges that allow margin trading, who encourage trading volumes.
The bottom line is that Bitcoin stays at the same price level, the same confluence price zone, between $7300 – $7400, which has a lot of supply and demand in it. The bears and the bulls are fighting over that region, and the war is going on as I’m writing these lines.
As of now, the market looks neutral with a bearish bias, due to the mid-term trend. Today, Bitcoin is entering the final day of the week, whereas the coming-up weekend is probably going to be exciting and volatile.
Total Market Cap: $200 billion
Bitcoin Market Cap: $133.7 billion
BTC Dominance Index: 66.8%
*Data by CoinGecko
Key Levels to Watch
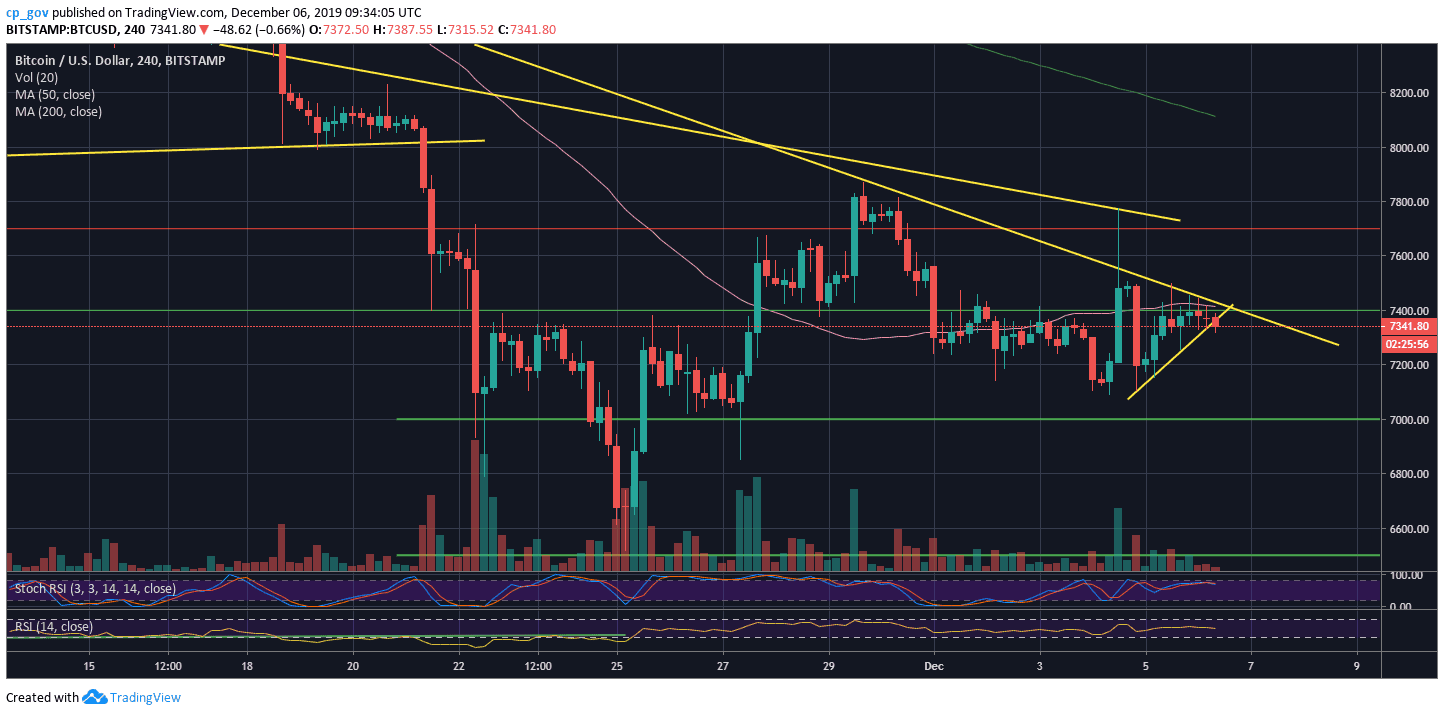
– Support/Resistance: As mentioned above, Bitcoin is back into the confluence zone between $7300 – $7400.
Looking on the 4-hour chart, we can clearly see the mid-term descending trend-line (together with the MA-50, which is marked by a pink line) in conjunction with short-term ascending trend-line.
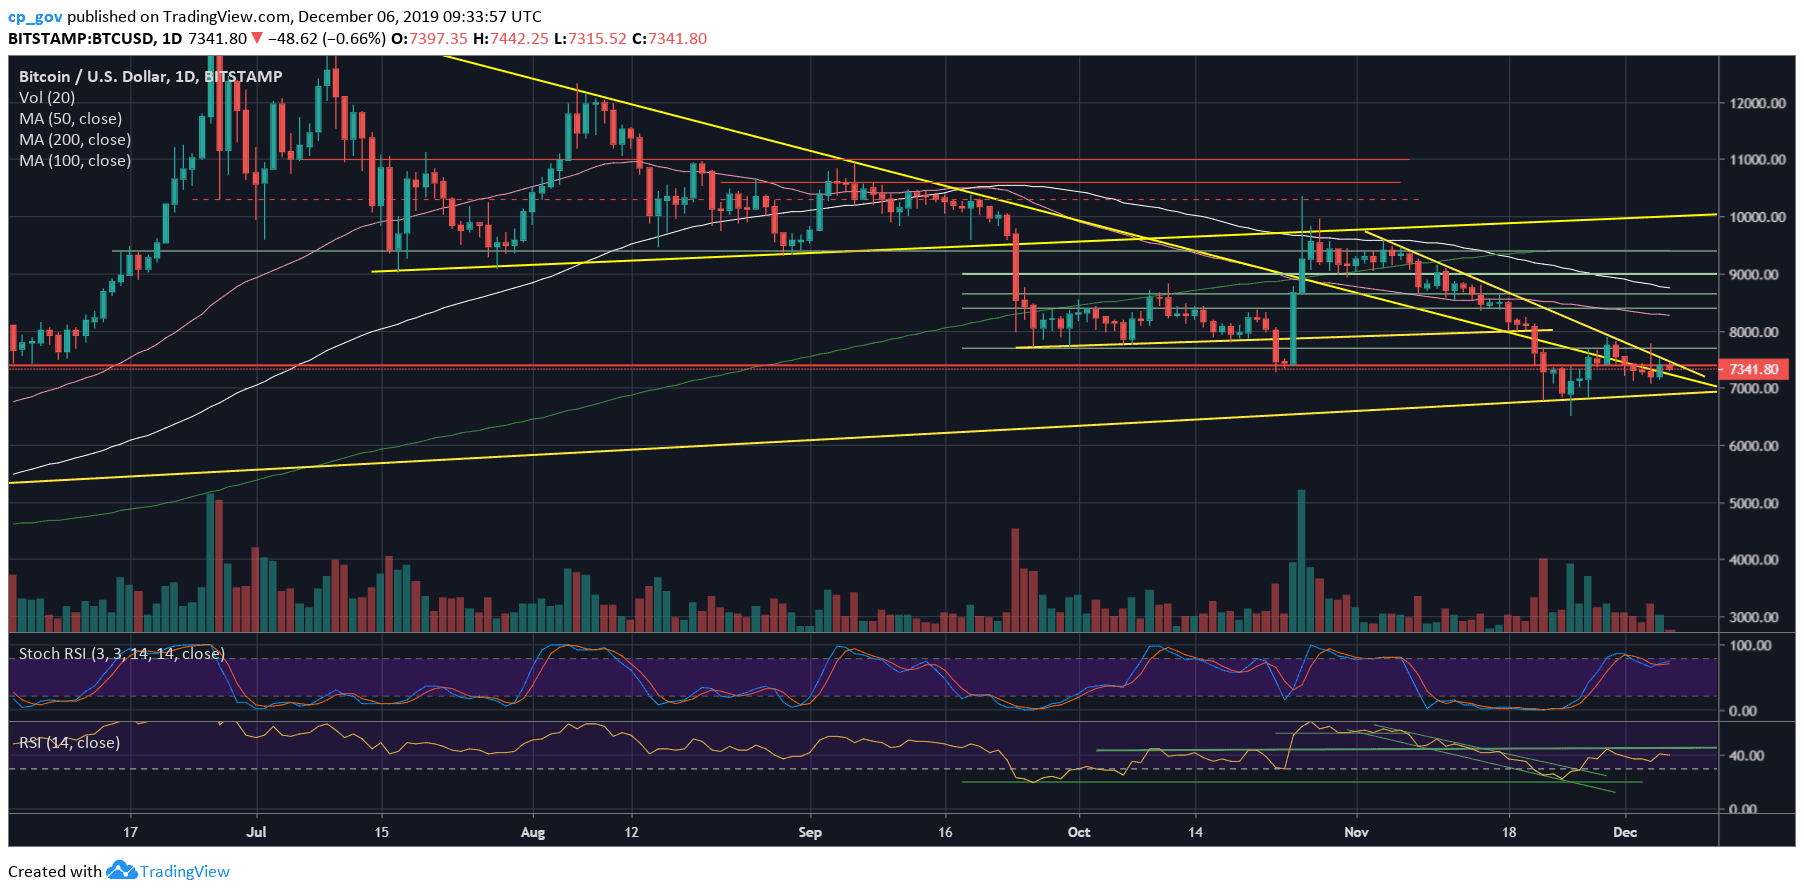
Bitcoin will have to make a short-term decision very soon. In the likely case of a breakdown, then the next support lies at $7200, $7100, and $7000 (along with the mid-term ascending trend-line on the daily chart). Further below is $6800, and the 6-month low around $6500.
From above, the next significant resistance beyond $7400 is $7700, which is also where the bullish spike reached out. A real market reverse could take place, in my opinion, only when creating a new higher low above $8000.
– The RSI Indicator: Nothing significant here. Following the price action, the RSI had created a lower low on the daily.
– Trading volume: As mentioned here on our recent price analysis, following declining days of volume, the last Wednesday price action ended as the highest volume day in 7 days.
BTC/USD BitStamp 4-Hour Chart
BTC/USD BitStamp 1-Day Chart