The last days saw Bitcoin trading under a tight range of 0, between 00 and 00.The good news is that Bitcoin is finally trading above the confluence zone of 00 – 00, along with the 4-hour MA-50, which was mentioned here more than once.Besides, the RSI is showing strength due to the negative divergence shown on both the following charts.However, Bitcoin is now facing a critical decision as the coin reaching a mid-term descending trend-line. This can be seen on both the following 4-hour and the 1-day charts. The decision is also reflected on the daily RSI, which is facing the critical 45-resistance resistance line.For almost a month, Bitcoin 1-day’s RSI couldn’t breach the 45 levels. As the weekend ends, and a new week starts, we can expect a volatile Monday ahead of us.Total
Topics:
Yuval Gov considers the following as important: Bitcoin Prediction, bitcoin price, BTC, BTCanalysis
This could be interesting, too:
Christian Mäder writes Bitcoin-Transaktionsgebühren auf historischem Tief: Warum jetzt der beste Zeitpunkt für günstige Überweisungen ist
Christian Mäder writes Das Bitcoin-Reserve-Rennen der US-Bundesstaaten: Wer gewinnt das Krypto-Wettrüsten?
Emily John writes Metaplanet Expands Bitcoin Holdings with .4M BTC Purchase
Christian Mäder writes Die besten Bitcoin-Visualisierungen: Ein Blick auf Preisentwicklung, Blockchain und Netzwerk
The last days saw Bitcoin trading under a tight range of $300, between $7300 and $7600.
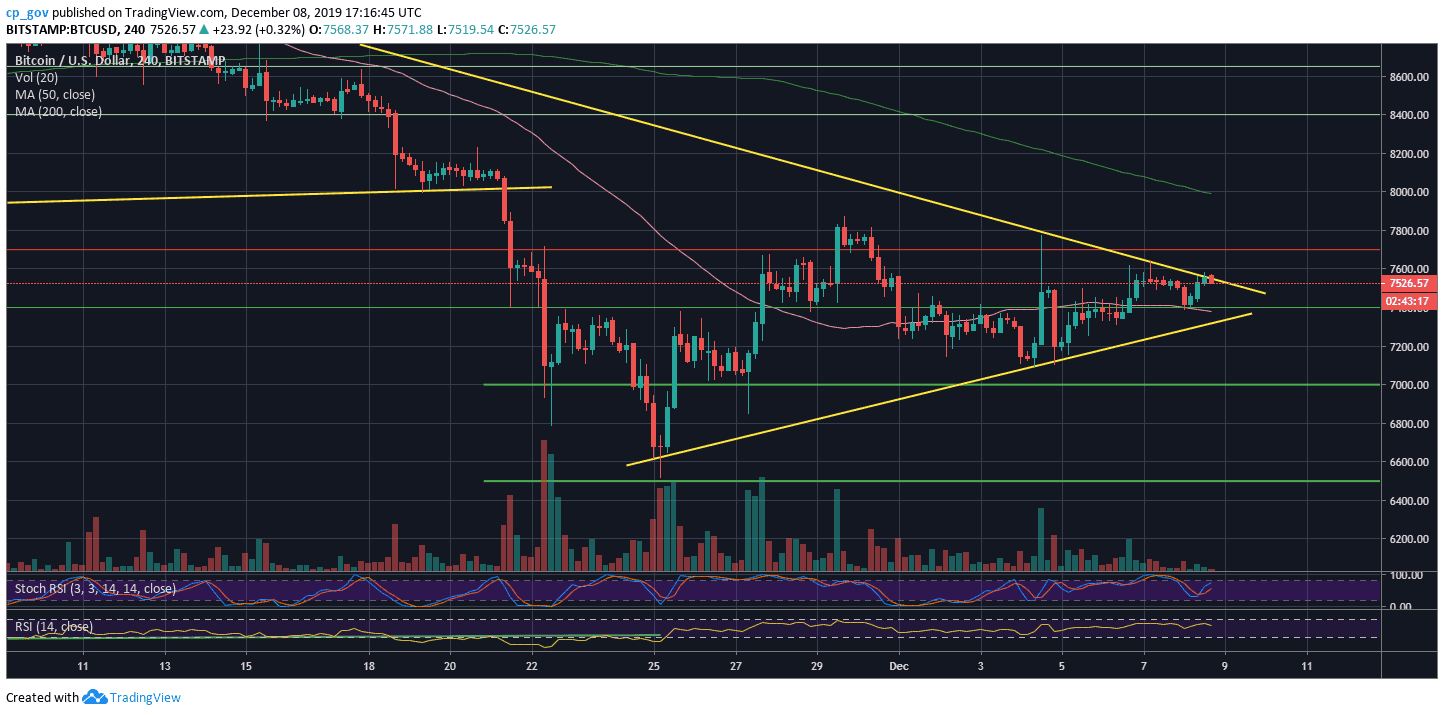
The good news is that Bitcoin is finally trading above the confluence zone of $7300 – $7400, along with the 4-hour MA-50, which was mentioned here more than once.
Besides, the RSI is showing strength due to the negative divergence shown on both the following charts.
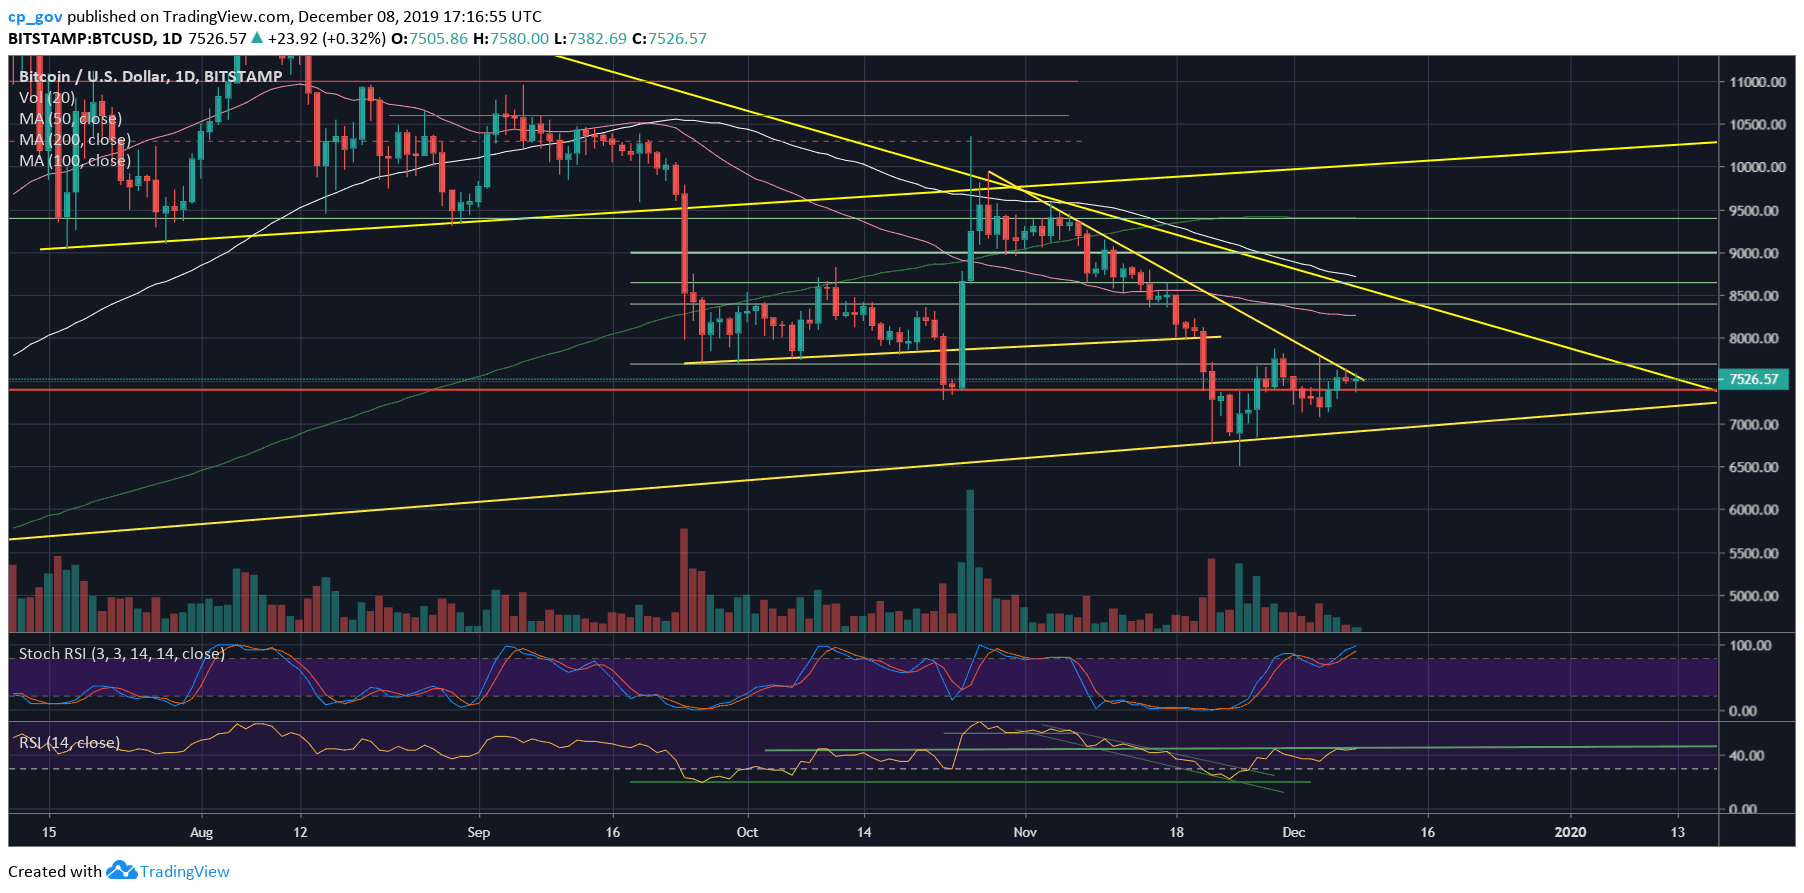
However, Bitcoin is now facing a critical decision as the coin reaching a mid-term descending trend-line. This can be seen on both the following 4-hour and the 1-day charts. The decision is also reflected on the daily RSI, which is facing the critical 45-resistance resistance line.
For almost a month, Bitcoin 1-day’s RSI couldn’t breach the 45 levels. As the weekend ends, and a new week starts, we can expect a volatile Monday ahead of us.
Total Market Cap: $205 billion
Bitcoin Market Cap: $136.8 billion
BTC Dominance Index: 66.7%
*Data by CoinGecko
Key Levels to Watch
– Support/Resistance: As mentioned above, Bitcoin is now facing the descending trend-line resistance. The next level is the $7700 – $7800 horizontal resistance. If Bitcoin can make it, further above lies $8000 and $8300.
From below, the first support is the 4-hour’s MA-50 line, marked by a pink line, along with horizontal support of $7300 – $7400, and an ascending trend-line on the 4-hour chart. Further below is the $7000 support, $6800, and the 6-month low around $6500.
– The RSI Indicator: As discussed above.
– Trading volume: Bitcoin had seen four consecutive days of a declining trading volume. This is another sign of a coming-up price move in the short-term.
BTC/USD BitStamp 4-Hour Chart
BTC/USD BitStamp 1-Day Chart