Two days ago, on our most recent BTC price analysis, we had mentioned that Bitcoin is reaching for a crucial long-term resistance line from 2019, we had also mentioned a bearish price divergence on the daily RSI.This resistance is the ascending trend-line marked on the following daily chart, which had started forming in July 2019. The line falls precisely on the ,500 mark. Yes, this is the high of yesterday and the current high of 2020.After touching ,500 for the third time in 48 hours, Bitcoin got rejected, and we saw some abnormal behavior on the 15-minute timeframe chart – the last retest of the ,500 and the rejection to below ,150 took no more than half an hour.The bottom line is that Bitcoin might need some more time to regain momentum and try again for the crucial
Topics:
Yuval Gov considers the following as important: Bitcoin (BTC) Price, BTCanalysis
This could be interesting, too:
Chayanika Deka writes XRP, SOL, and ADA Inclusion in US Crypto Reserve Pushes Traders on Edge
Chayanika Deka writes Why Arthur Hayes Is Bullish on Bitcoin Under Trump’s Economic Strategy
Mandy Williams writes Why the Bitcoin Market Is Stuck—and the Key Metric That Could Change It: CryptoQuant CEO
Jordan Lyanchev writes Liquidations Top 0M as Bitcoin Falls K, Reversing Trump-Driven Rally
Two days ago, on our most recent BTC price analysis, we had mentioned that Bitcoin is reaching for a crucial long-term resistance line from 2019, we had also mentioned a bearish price divergence on the daily RSI.
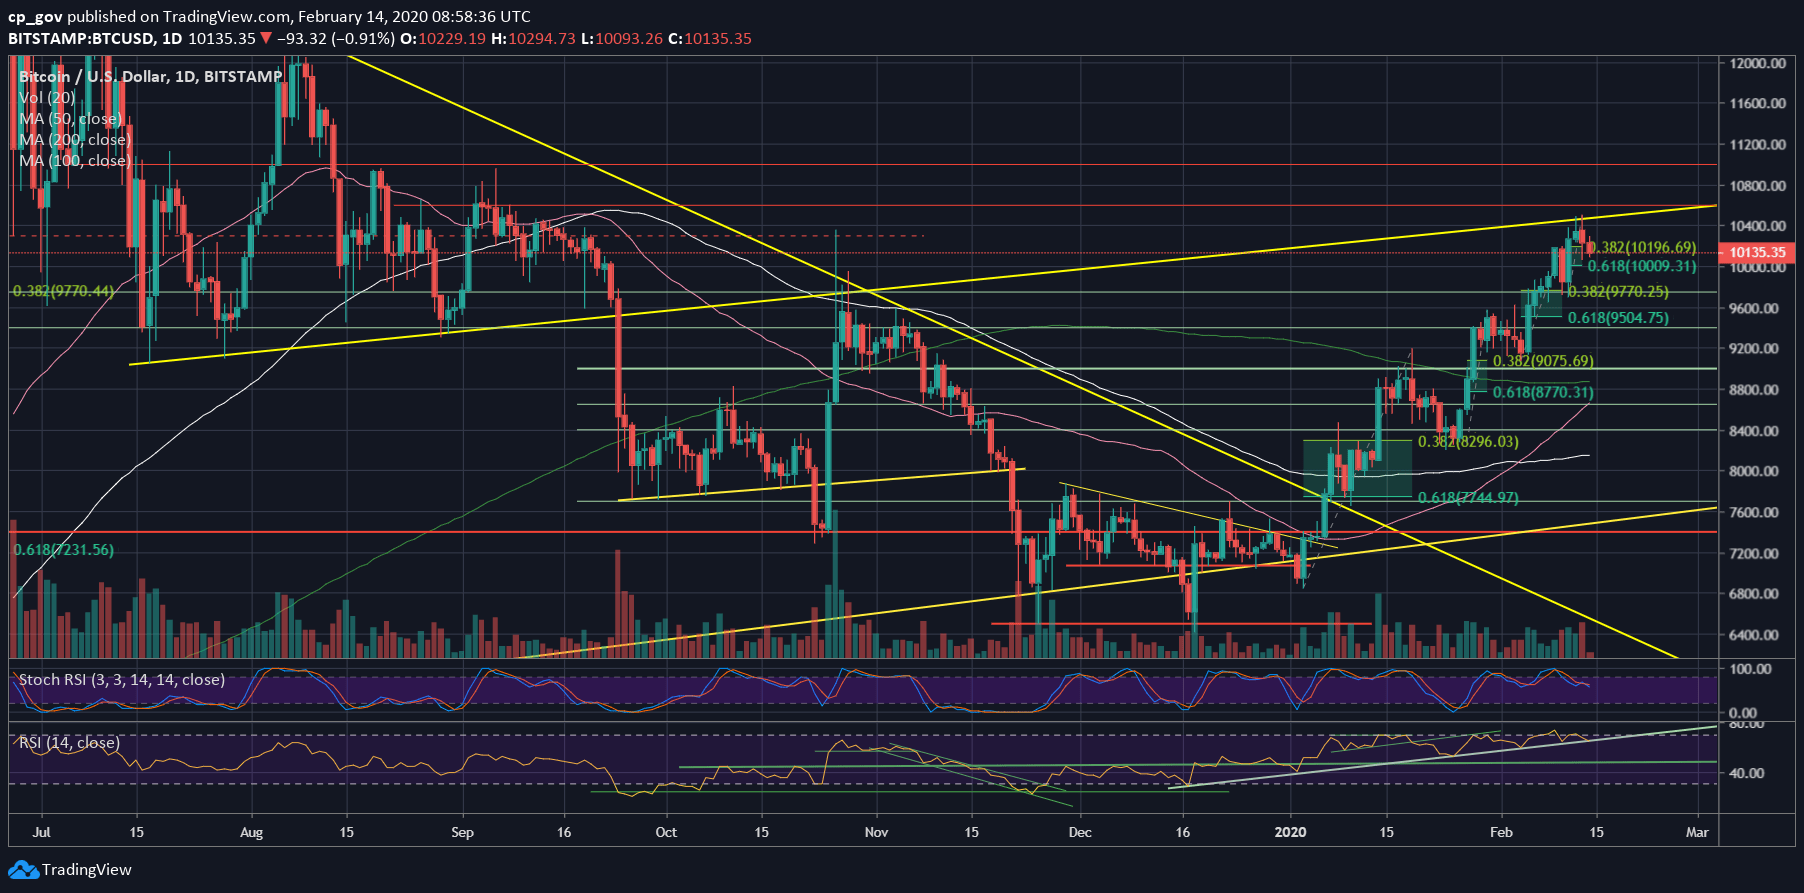
This resistance is the ascending trend-line marked on the following daily chart, which had started forming in July 2019. The line falls precisely on the $10,500 mark. Yes, this is the high of yesterday and the current high of 2020.
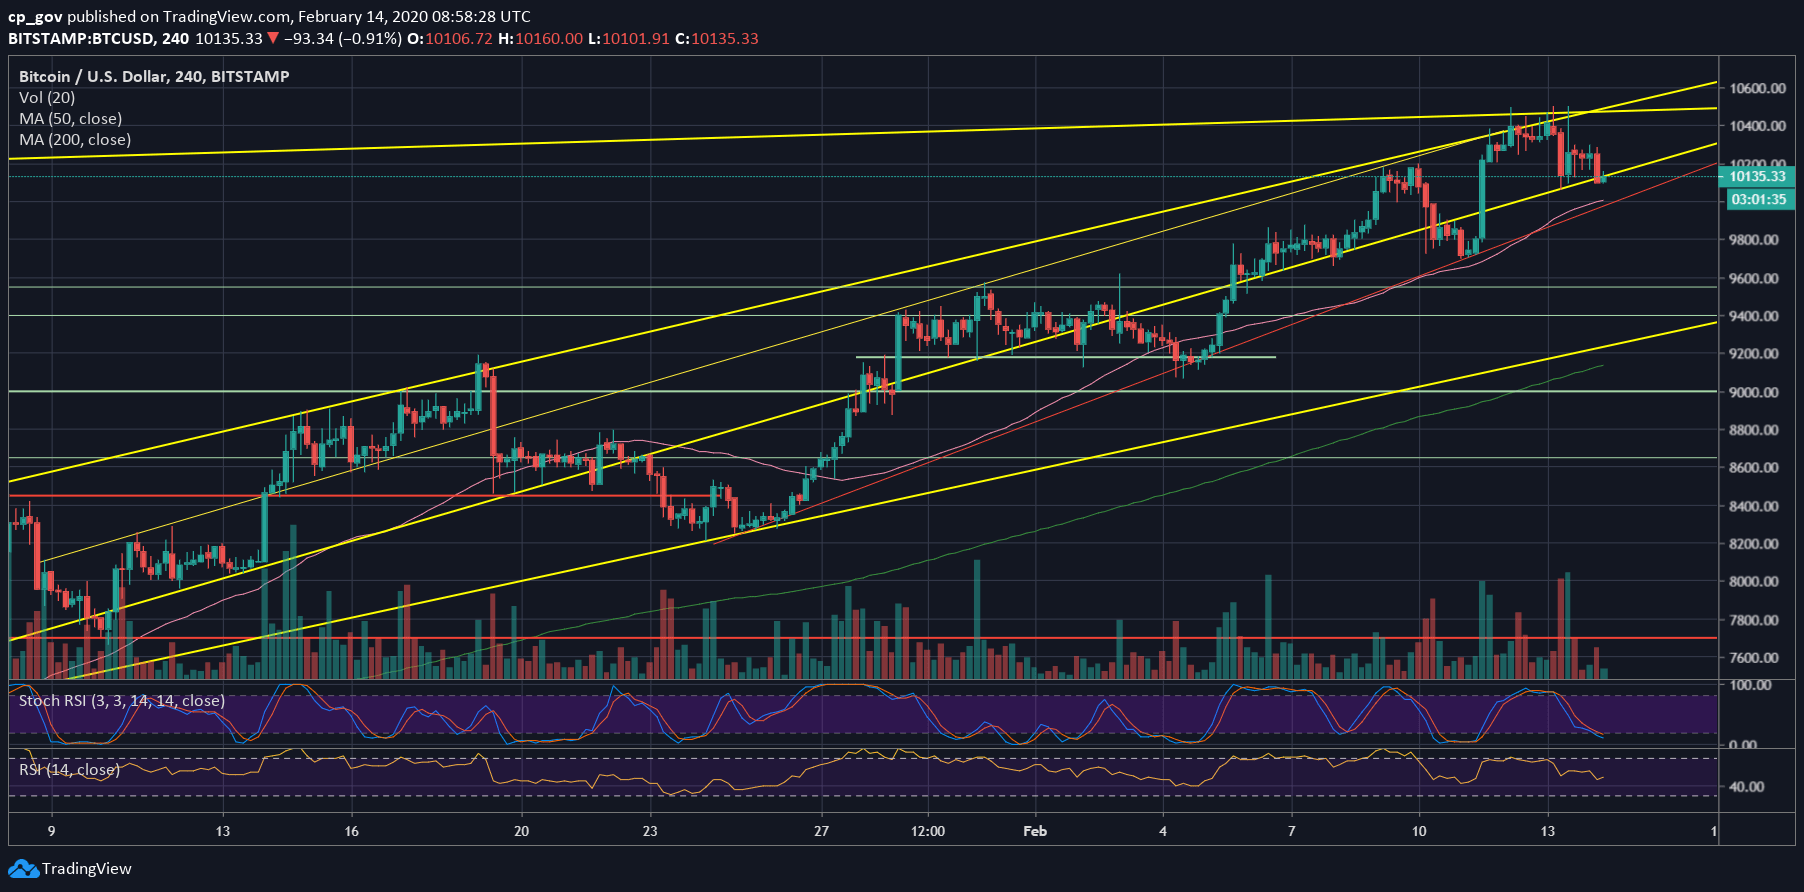
After touching $10,500 for the third time in 48 hours, Bitcoin got rejected, and we saw some abnormal behavior on the 15-minute timeframe chart – the last retest of the $10,500 and the rejection to below $10,150 took no more than half an hour.
The bottom line is that Bitcoin might need some more time to regain momentum and try again for the crucial ascending trend-line resistance.
The Mini-Rallies Rule Is Gone
Unlike the past three mini-rallies since 2020 begun, this time the correction was deeper and broke down the significant 38.2% Fibonacci retracement level (~$10,200).
Meanwhile, the altcoins are gaining momentum against Bitcoin, as can be told by the BTC dominance level, which is at its lowest level since July 2019.
Total Market Cap: $299.3 billion
Bitcoin Market Cap: $184.7 billion
BTC Dominance Index: 61.7%
*Data by CoinGecko
Key Levels To Watch & Next Possible Targets
– Support/Resistance levels: Following the rejection of $10,500, Bitcoin is trading below the $10,200 resistance level. The next level of support is around $10,000, which is also the 61.8% Fib level. Further below lies $9900 and $9700.
From above, in case Bitcoin hold above $10,200, then the next level of resistance is $10,300 before the 2020 high at $10,500, along with the significant mentioned ascending trend-line. The next resistance would be $10,600, followed by $11,000 and $11,200.
– The RSI Indicator: We had mentioned a bearish price divergence on our previous analysis. This might have signaled a temp end to the bullish trend of Bitcoin.
However, as of writing these lines, the RSI is encountering the crucial higher lows trend-line. If it fails to find support here, then we can expect the correction to get even deeper.
– Trading volume: Yesterday was the highest volume day since January 28, hence, more than two weeks. This might not be a positive sign for Bitcoin Bulls.


