Ethereum rolled over from expected resistance at 8.80 as it dropped by a small 1.5% to reach 4.ETH has been the second strongest performing top 10 cryptocurrency (behind Tezos) over the past 30-days with a 65% price increase.Against Bitcoin, it broke significant resistance at 0.025 BTC to reach 0.026 BTC.Key Support & Resistance LevelsETH/USDSupport: 1, 0, 0.Resistance: 9, 7, 0.ETH/BTCSupport: 0.025 BTC , 0.024 BTC, 0.0236 BTC.Resistance: 0.027 BTC, 0.0278 BTC, 0.0288 BTC .ETH/USD: Ethereum Rolls Over At 9Since our last analysis, Ethereum continued to drive higher from 5 as it broke above 0 to reach the resistance at 8.80, provided by the long term bearish .618 Fib Retracement.More specifically, the cryptocurrency spiked to 7 (1.618 Fib Extension
Topics:
Yaz Sheikh considers the following as important: ETH Analysis, Ethereum (ETH) Price
This could be interesting, too:
Mandy Williams writes Ethereum Derivatives Metrics Signal Modest Downside Tail Risk Ahead: Nansen
CryptoVizArt writes Will Weak Momentum Drive ETH to .5K? (Ethereum Price Analysis)
Mandy Williams writes Ethereum Key Metrics Point to Persistent Bullish Outlook for ETH: CryptoQuant
CryptoVizArt writes Ethereum Price Analysis: Following a 15% Weekly Crash, What’s Next for ETH?
- Ethereum rolled over from expected resistance at $268.80 as it dropped by a small 1.5% to reach $264.
- ETH has been the second strongest performing top 10 cryptocurrency (behind Tezos) over the past 30-days with a 65% price increase.
- Against Bitcoin, it broke significant resistance at 0.025 BTC to reach 0.026 BTC.
Key Support & Resistance Levels
ETH/USD
Support: $251, $240, $230.
Resistance: $269, $277, $290.
ETH/BTC
Support: 0.025 BTC , 0.024 BTC, 0.0236 BTC.
Resistance: 0.027 BTC, 0.0278 BTC, 0.0288 BTC .
ETH/USD: Ethereum Rolls Over At $269
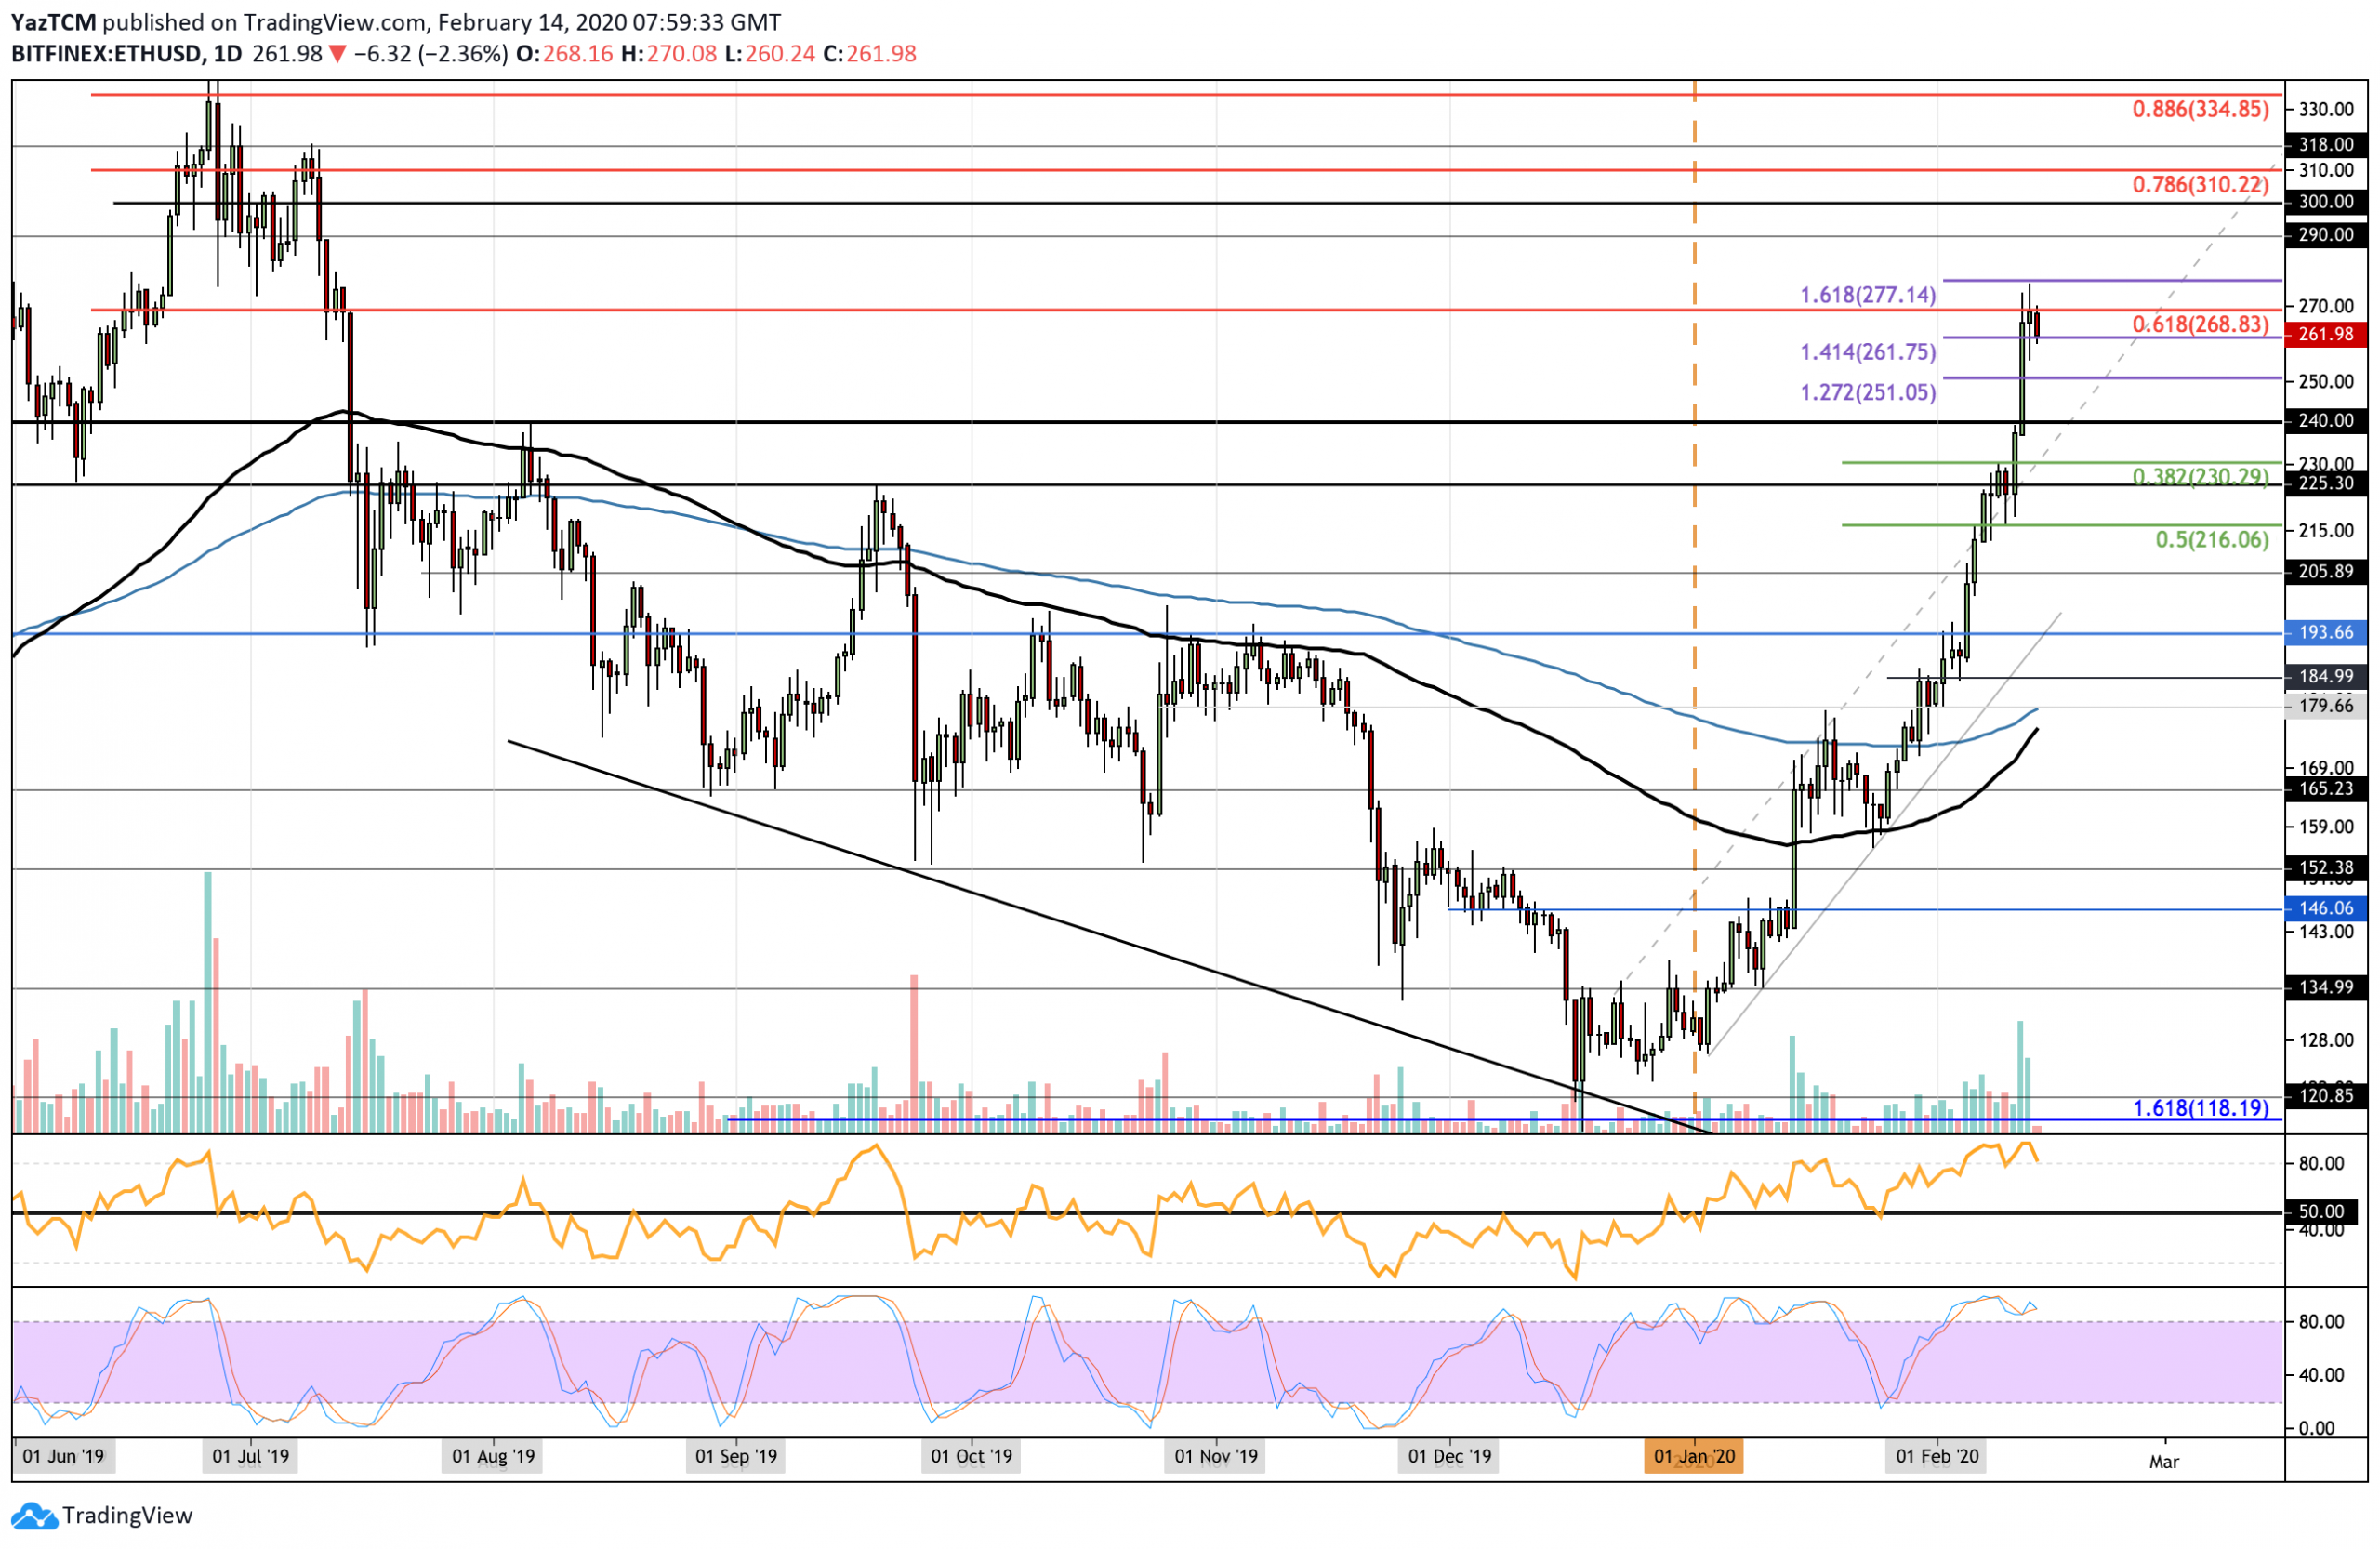
Since our last analysis, Ethereum continued to drive higher from $255 as it broke above $260 to reach the resistance at $268.80, provided by the long term bearish .618 Fib Retracement.
More specifically, the cryptocurrency spiked to $277 (1.618 Fib Extension level), where it stalled and rolled over to reach the current price at $262.
Ethereum’s bullish run has been parabolic in 2020 after it increased by 108% throughout the year. A retracement should be expected pretty soon as these kinds of price increases are rarely sustained over more extended periods.

Ethereum Short Term Price Prediction
If the bears break beneath $260, the first level of support is located at $251. Beneath this, additional support cand be found at $240, $230 (short term .382 Fib Retracement), and $225.
Alternatively, if the bulls defend $260 and rebound, the first level of resistance lies at $269 (bearish .618 Fib Retracement). Above $270, resistance lies at $277 (1.618 Fib Extension), $290, and $300.
The RSI has rolled over from extremely overbought conditions as it starts to point downward. This is a sign that the parabolic bullish momentum may be starting to fade. It can be considered as a good sign because it gives some space for the bulls to “breath” and regroup before bouncing higher again.
ETH/BTC: ETH Reaches 0.0261 BTC Resistance – Can Bulls Break Above?
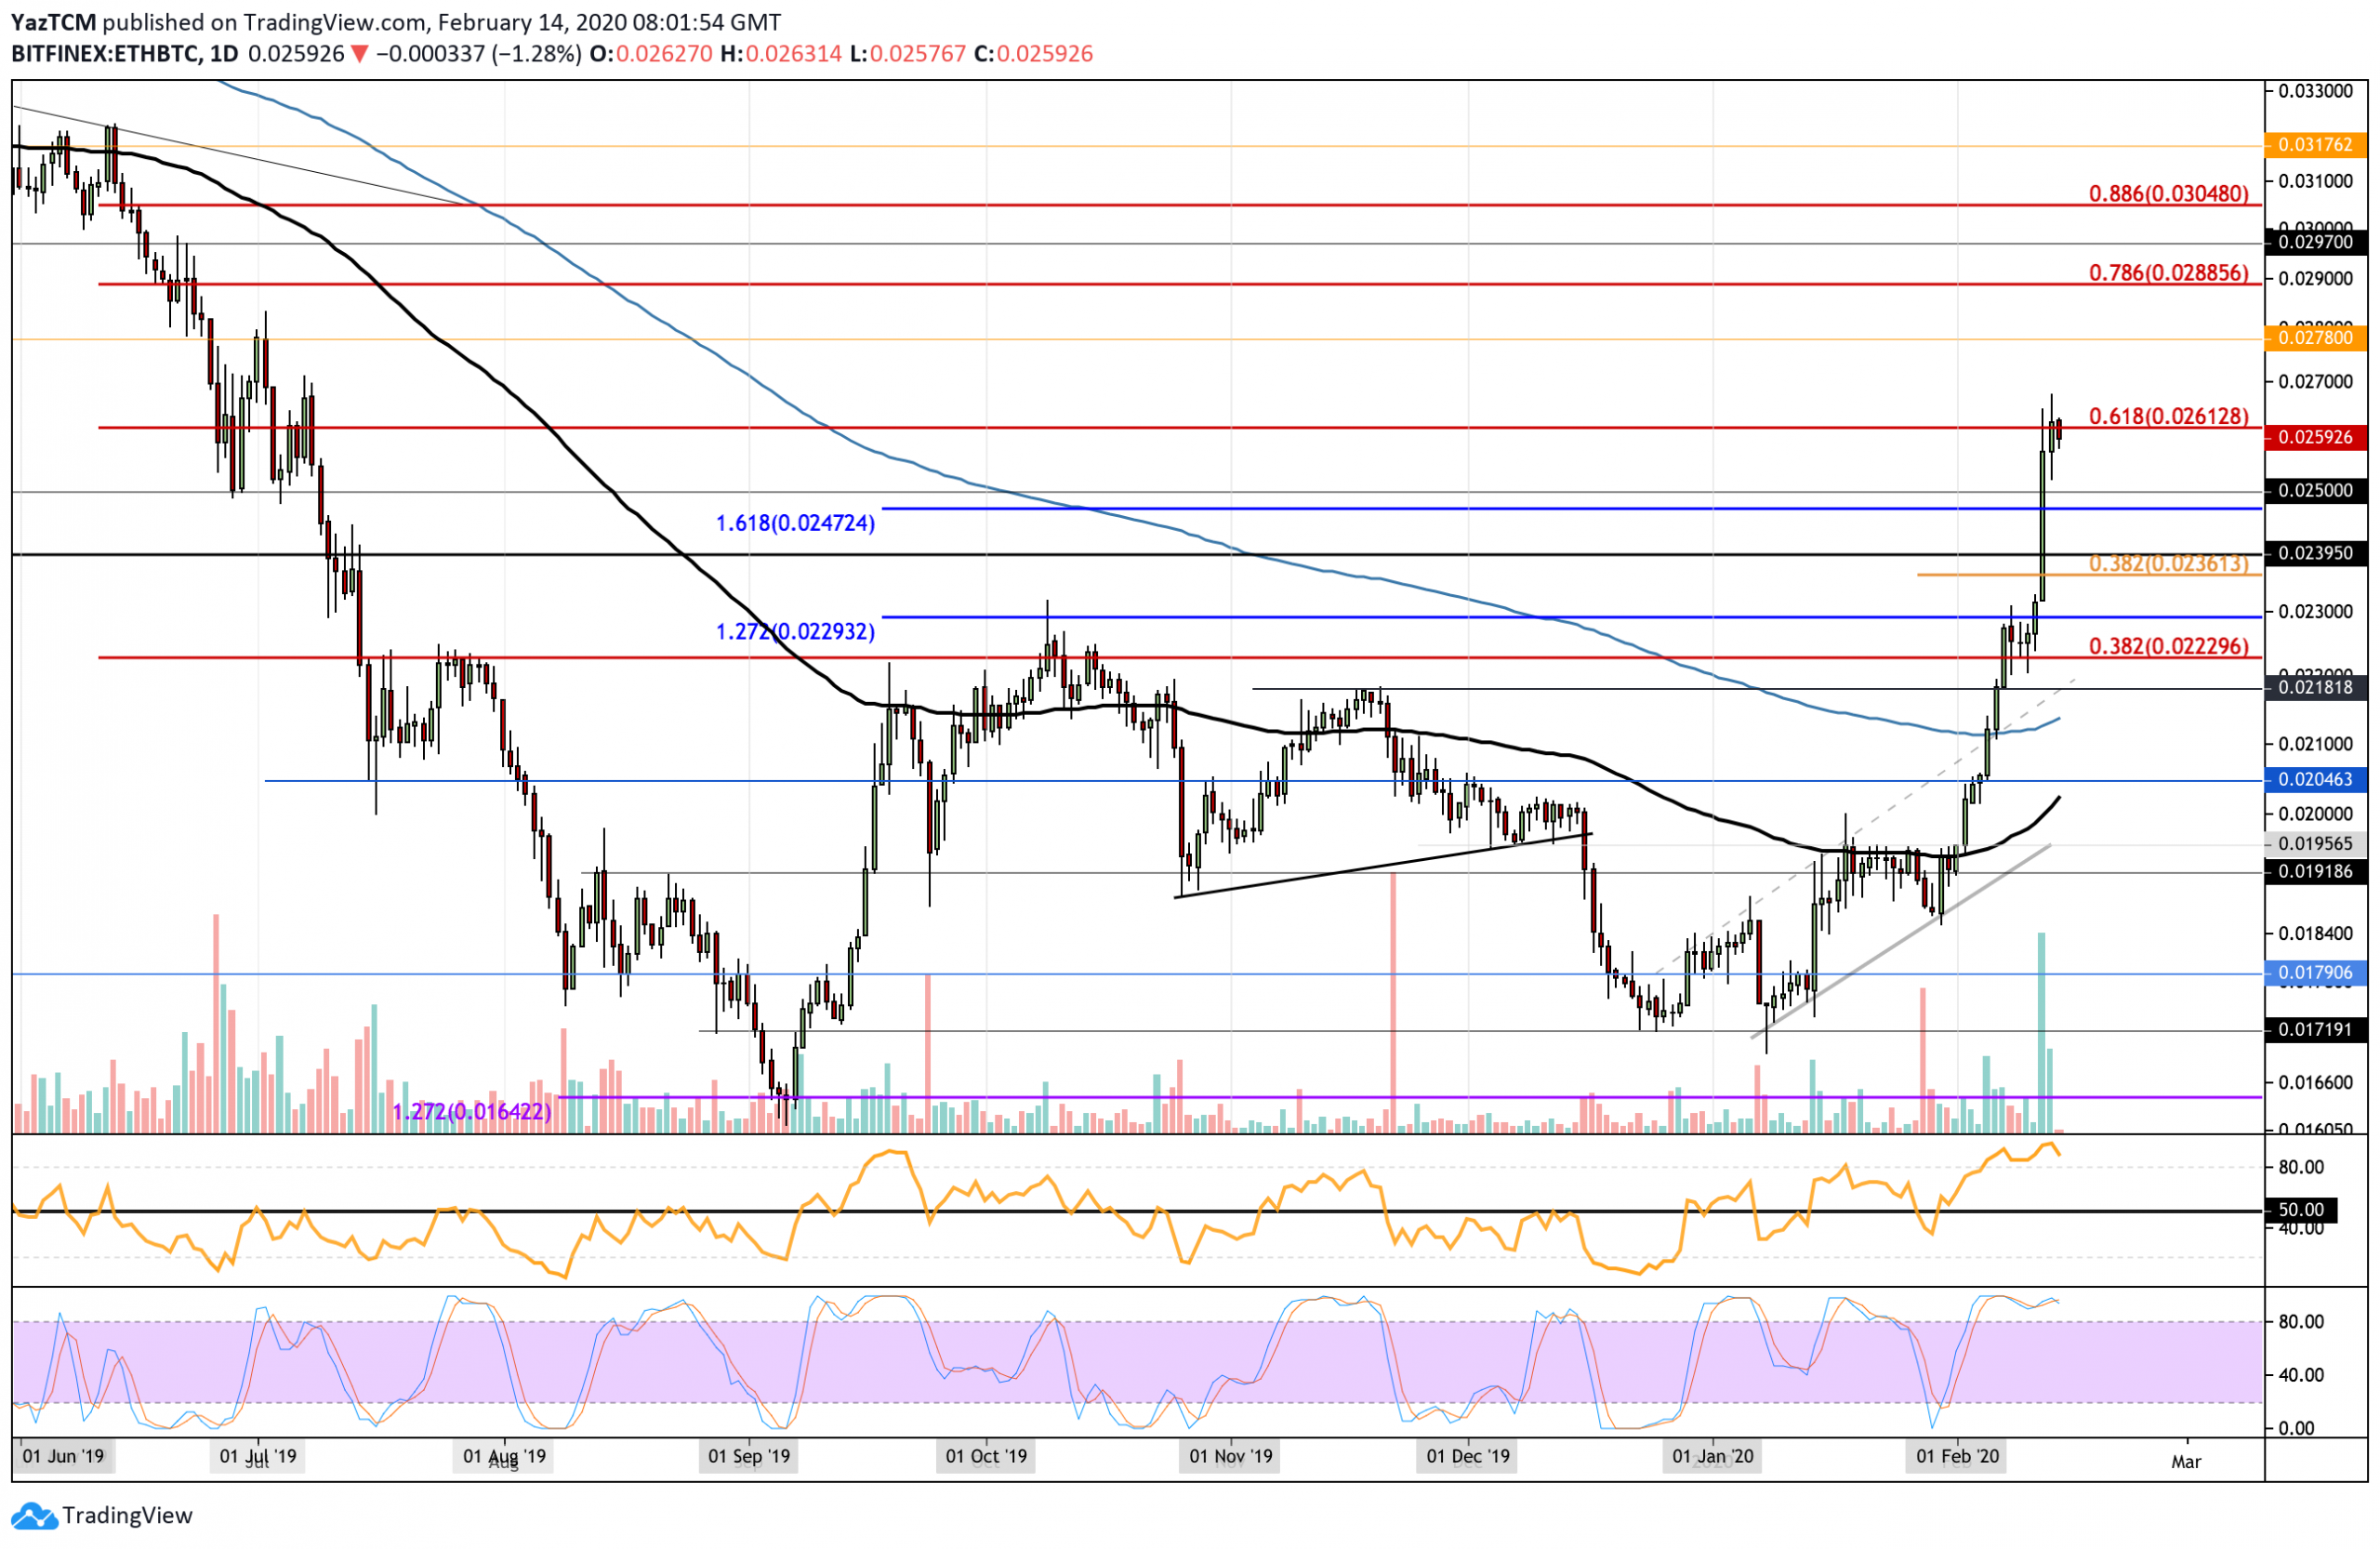
Against Bitcoin, Ethereum continued to climb higher from the resistance at 0.0247 BTC as it went on to penetrate above 0.025 BTC. It rose further higher from here to reach the resistance at 0.0261 BTC, provided by the long term bearish .618 Fib Retracement.
Ethereum remains strongly bullish and will continue to be so long as the buyers can defend the 0.025 BTC level. A drop beneath 0.025 BTC may signal a loss of momentum, and it could drive ETH/BTC lower.

Ethereum Short Term Price Prediction
If the sellers step in and push ETH/BTC lower, the first level of strong support lies at 0.025 BTC. Beneath this, additional support lies at 0.024 BTC, 0.0236 BTC (short term .382 Fib Retracement), and 0.0229 BTC.
On the other hand, if the bulls can break 0.0261 BTC, higher resistance lies at 0.027 BTC, 0.0278 BTC, and 0.0288 BTC (long term bearish .786 Fib Retracement).
Similarly, the RSI has started to point down but remains in extremely overbought conditions. A further drop of the RSI is expected to bring it toward a more sustainable level. Additionally, the Stochastic RSI is primed for a bearish crossover signal in overbought conditions.
