Yesterday we analyzed the current situation of BTC’s price. On the 4-hour chart, the symmetrical triangle pattern was about to break-down once reaching the lower ascending trend-line. However, Bitcoin held the support line nicely and since then, surged 0 in just a few hours.The triangle formation indeed broke-out but in favor of the bulls. As of writing these lines, the coin had reached our mentioned resistance area of 00 – 00, and it’s now trading steadily above the 00 resistance turned support line.Does this mean the bulls are back? It’s very early to say so. Looking at the following chart, we can clearly see the higher highs trajectory, which is bearish. However, this can be changed in case Bitcoin breaks above the 00 benchmark. As a reminder, since the fatal drop of
Topics:
Yuval Gov considers the following as important: Bitcoin (BTC) Price, BTC Analysis, btcusd
This could be interesting, too:
Mandy Williams writes Bitcoin ETFs Record Over .6B in Outflows in the Past 2 Weeks
Chayanika Deka writes Bitcoin Whales Offload 6,813 BTC as Selling Pressure Mounts
Wayne Jones writes Bitcoin Sentiment Hits 2022 Lows as Fear & Greed Index Falls to 10
Jordan Lyanchev writes Bitcoin Falls Below K for the First Time in 3 Months, How Much Lower Can It Go?
Yesterday we analyzed the current situation of BTC’s price. On the 4-hour chart, the symmetrical triangle pattern was about to break-down once reaching the lower ascending trend-line. However, Bitcoin held the support line nicely and since then, surged $600 in just a few hours.
The triangle formation indeed broke-out but in favor of the bulls. As of writing these lines, the coin had reached our mentioned resistance area of $6800 – $6900, and it’s now trading steadily above the $6600 resistance turned support line.
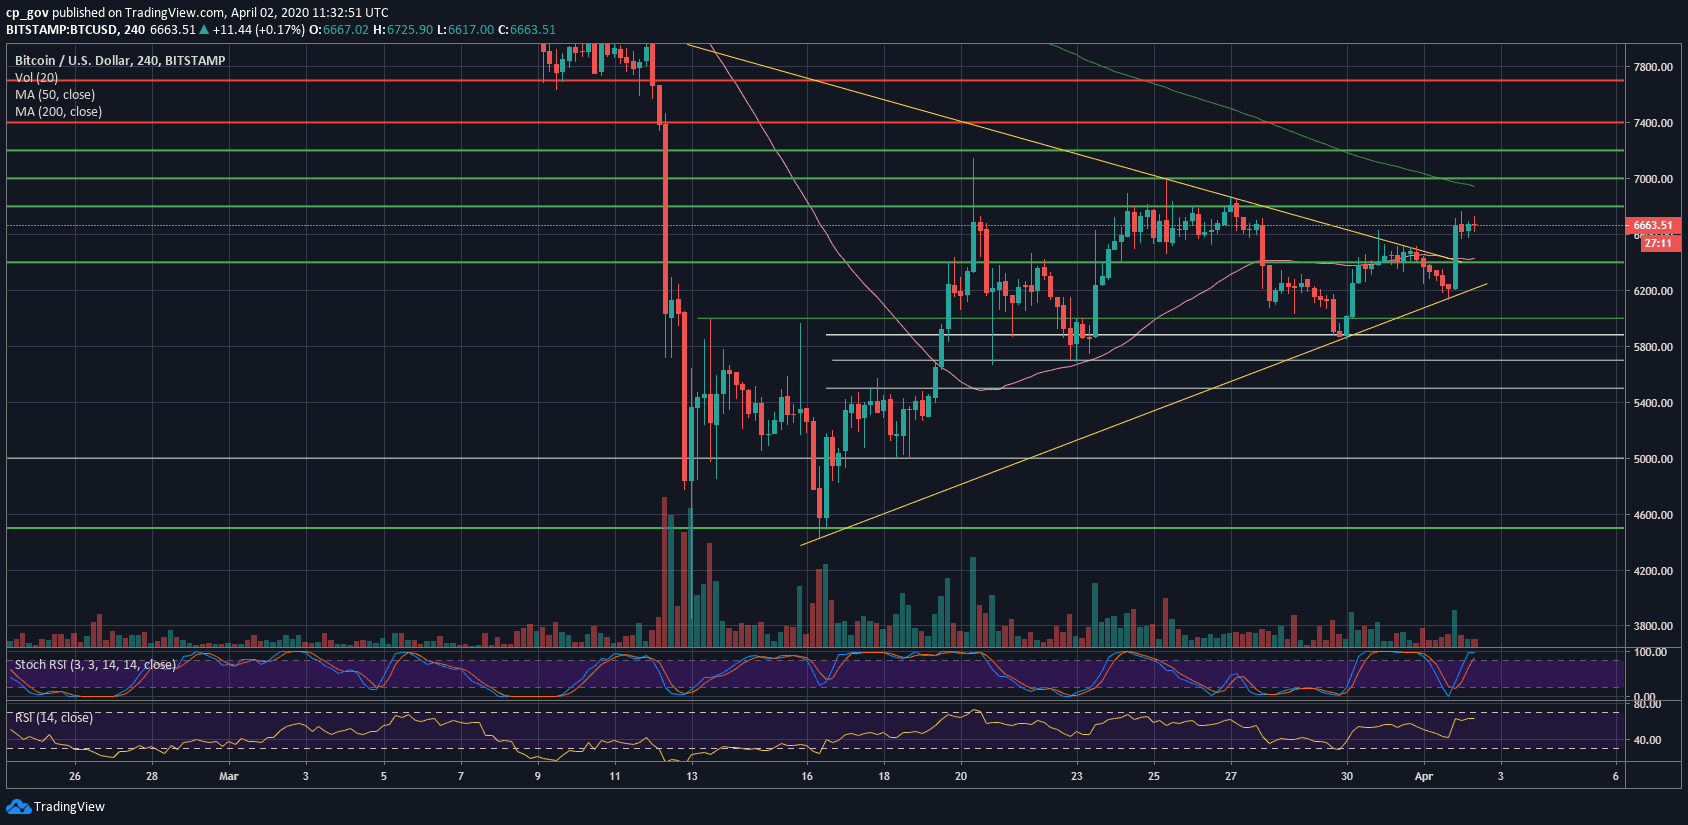
Does this mean the bulls are back? It’s very early to say so. Looking at the following chart, we can clearly see the higher highs trajectory, which is bearish. However, this can be changed in case Bitcoin breaks above the $7000 benchmark. As a reminder, since the fatal drop of March 12, the high recorded was $7139 on Bitstamp on March 20.
Despite the surge in the price of Bitcoin, the altcoins are currently left behind and are not taking part in this party.
Total Market Cap: $186.4 billion
Bitcoin Market Cap: $121.7 billion
BTC Dominance Index: 65.3%
*Data by CoinGecko
Key Levels To Watch & Next Possible Targets
– Support/Resistance levels: Following the breakout, Bitcoin soared till reaching the $6800 resistance ($6766 on Bitstamp). This price area is the first level of resistance.
In case of a break-up, we can expect the next target to be $7000 and $7200 (the high as mentioned above from March 20). Breaking above the highest price since the massive drop of March 12 could be a very positive sign for Bitcoin.
From below, the first level of support now lies at $6600. Further below is the 4-hour MA-50 line, marked by pink, together with the $6300 – $6400 price range. This is followed by $6200 and the low from yesterday – $6137 (Bitstamp).
– The RSI Indicator: After yesterday’s breakout, the RSI is facing the critical resistance of 48-50 again. However, we already identify bullish divergence, which can fuel the next move above.
Also, and as an update to yesterday’s analysis, the Stochastic RSI oscillator had made a bullish crossover, out of the danger zone.
– Trading volume: After days of declining volume, finally some price action. Added to the above, the volume is still not significant compared to the highest days of March.
BTC/USD BitStamp 4-Hour Chart
BTC/USD BitStamp 1-Day Chart
