This past week was a blessing for the price of Bitcoin. The primary cryptocurrency was trading around 00 just a week ago, while the highest of the past week reached over 00.Only ten days left until the anticipated Bitcoin halving event, and so far, it seems like BTC fires its engines. As of writing these lines, the coin is safely maintaining the 00 price zone.If we look at the macro level, since breaking out from the 00 – 00 region, a zone which was consisted of some significant resistance marks such as the 200-days moving average line (marked by the light green line on the 1-day chart), Bitcoin is constructing a new bullish run. On the following 4-hour chart, you can see the bullish triangle that was breached at 00 and exploded since then.Wednesday saw the highest level
Topics:
Yuval Gov considers the following as important: Bitcoin (BTC) Price, BTC Analysis, btcusd, btcusdt
This could be interesting, too:
Chayanika Deka writes XRP, SOL, and ADA Inclusion in US Crypto Reserve Pushes Traders on Edge
Chayanika Deka writes Why Arthur Hayes Is Bullish on Bitcoin Under Trump’s Economic Strategy
Mandy Williams writes Why the Bitcoin Market Is Stuck—and the Key Metric That Could Change It: CryptoQuant CEO
Wayne Jones writes Metaplanet Acquires 156 BTC, Bringing Total Holdings to 2,391
This past week was a blessing for the price of Bitcoin. The primary cryptocurrency was trading around $7500 just a week ago, while the highest of the past week reached over $9400.
Only ten days left until the anticipated Bitcoin halving event, and so far, it seems like BTC fires its engines. As of writing these lines, the coin is safely maintaining the $8800 price zone.
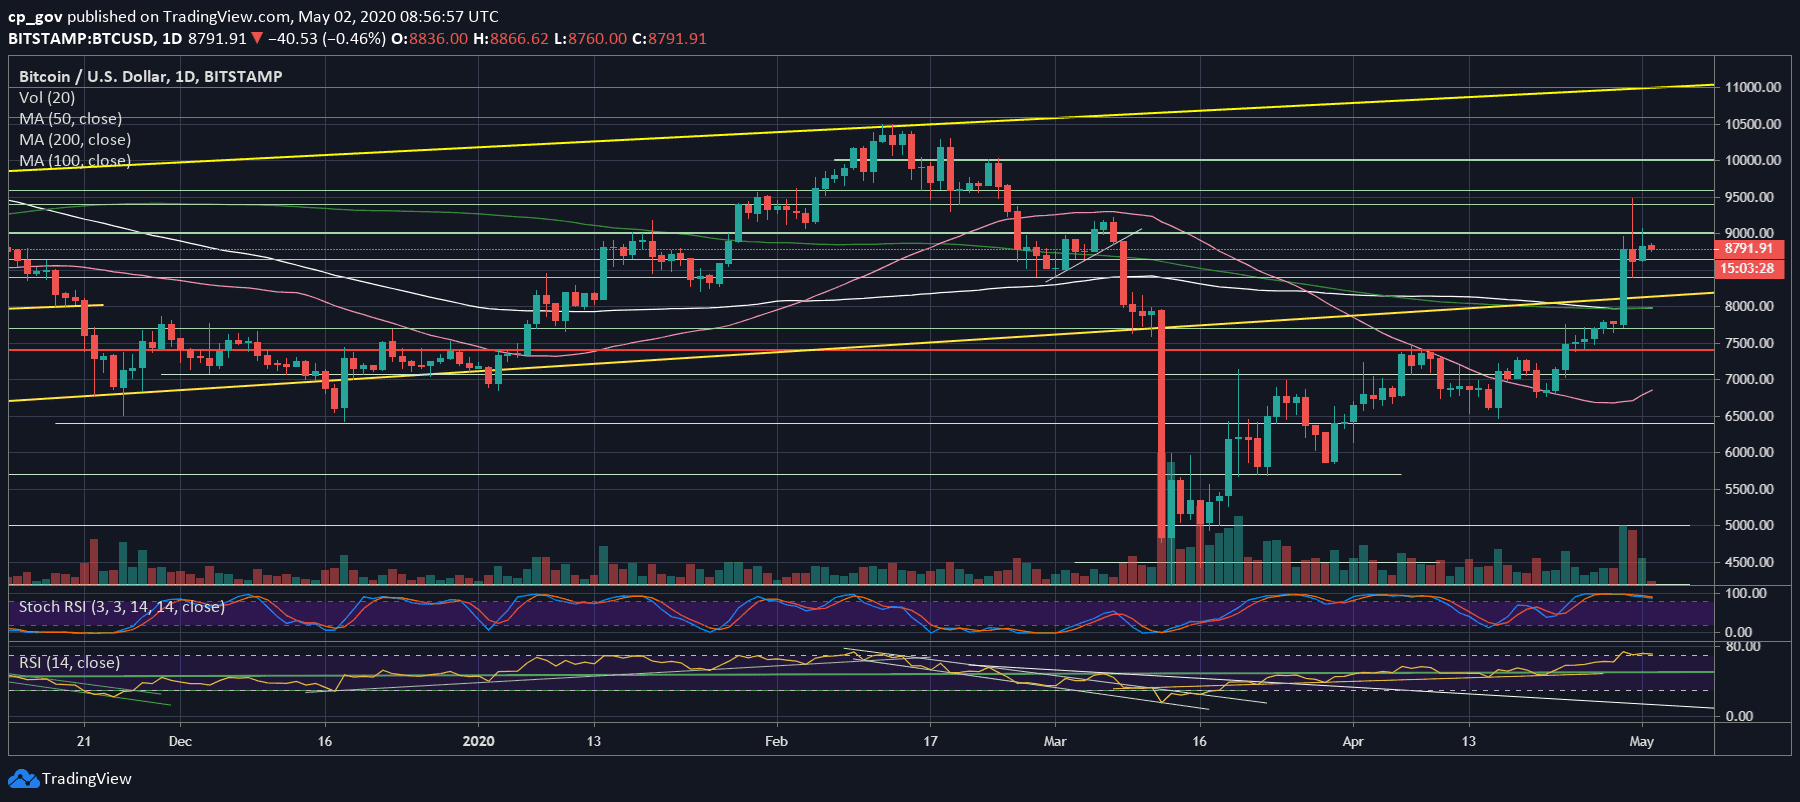
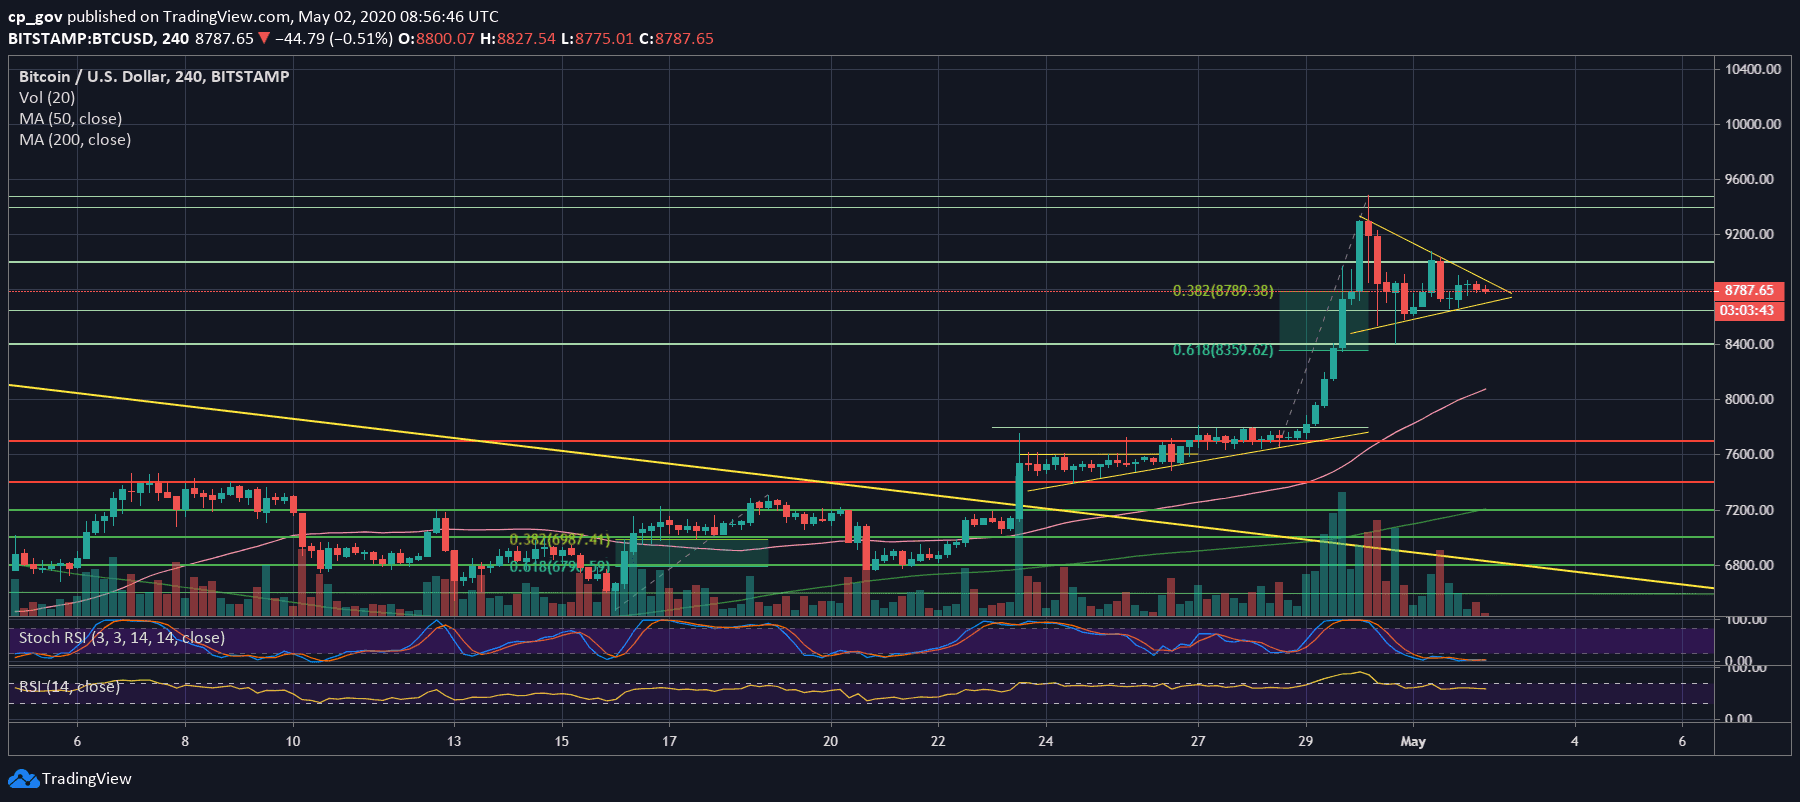
If we look at the macro level, since breaking out from the $7800 – $8000 region, a zone which was consisted of some significant resistance marks such as the 200-days moving average line (marked by the light green line on the 1-day chart), Bitcoin is constructing a new bullish run. On the following 4-hour chart, you can see the bullish triangle that was breached at $7800 and exploded since then.
Wednesday saw the highest level of trading volume on Binance, which is another sign that the price surge is real.
As we wrote on Thursday in the previous price analysis (when BTC was over $9K) – ‘we are likely to see a correction soon.’ Without surprises, Bitcoin corrected nicely to $8400. Why is it ‘nicely’? Because this is accurately the Golden Fibonacci level – 61.8% – of the recent surge.
Since then, Bitcoin recovered to where it is trading at now, despite a 2-day crash on the stock markets. Decoupling, finally? Only time will tell.
Total Market Cap: $248 billion
Bitcoin Market Cap: $162.3 billion
BTC Dominance Index: 65.4%
*Data by CoinGecko
Key Levels To Watch & Next Possible Targets
– Support/Resistance levels: Bitcoin is trading at the confluence zone of $8800, which is also the Fib level of 38.2% from the recent bullish move. As of writing these lines. The first level of resistance, if we look up, would be $9000.
Further above lies the peak levels from Thursday morning at $9400 – $9500. In case of a breakup, we can expect some resistance at $9800, before reaching the $10,000 mark.
From below, in case the support at $8800 breaks, the next support lies around $8650, followed by Thursday’s low at $8400 (the Golden Fib level). Further below lies $8200 and $8000.
– The RSI Indicator: Despite the severe correction to $8400, the momentum indicator is deep in the bullish territory, maintaining the 70 levels.
– Trading volume: As mentioned above – a bullish sentiment is also seen in this category.
Wednesday and Thursday were both very high by means of the trading volume. Friday’s volume was high as well, compared to the monthly average. We can expect some calm volume levels during the weekend, but Bitcoin might surprise with its next major move.
BTC/USD BitStamp 4-Hour Chart
BTC/USD BitStamp 1-Day Chart