Two days ago, while Bitcoin was consolidating around the 00 level, we had anticipated a huge price move coming up.Looking at the following 4-hour chart, we can see that Bitcoin had found support upon the mentioned 4-hour MA-50 line (~00, marked pink), and following another Fed’s announcement, broke above the short-term descending trend-line.In the same price analysis from two days ago, we also mentioned the bullish divergence on the 4-hour chart, which might have proved an accumulation process of Bitcoin by the whales, around the K level.The breakout followed the Fed’s notice sent Bitcoin price to surge about 13% in just an hour. After the rejection, the critical support at 00 was maintained nicely. As of writing these lines, Bitcoin is up 12% over the past 24 hours, while S&P
Topics:
Yuval Gov considers the following as important: Bitcoin (BTC) Price, BTC Analysis, btcusd
This could be interesting, too:
Mandy Williams writes Bitcoin ETFs Record Over .6B in Outflows in the Past 2 Weeks
Chayanika Deka writes Bitcoin Whales Offload 6,813 BTC as Selling Pressure Mounts
Wayne Jones writes Bitcoin Sentiment Hits 2022 Lows as Fear & Greed Index Falls to 10
Jordan Lyanchev writes Bitcoin Falls Below K for the First Time in 3 Months, How Much Lower Can It Go?
Two days ago, while Bitcoin was consolidating around the $6000 level, we had anticipated a huge price move coming up.
Looking at the following 4-hour chart, we can see that Bitcoin had found support upon the mentioned 4-hour MA-50 line (~$5700, marked pink), and following another Fed’s announcement, broke above the short-term descending trend-line.
In the same price analysis from two days ago, we also mentioned the bullish divergence on the 4-hour chart, which might have proved an accumulation process of Bitcoin by the whales, around the $6K level.
The breakout followed the Fed’s notice sent Bitcoin price to surge about 13% in just an hour. After the rejection, the critical support at $6400 was maintained nicely. As of writing these lines, Bitcoin is up 12% over the past 24 hours, while S&P 500 finished its Monday’s trading day by a 3% plunge.
Despite the increasing amount of crypto influencers who believed that Bitcoin is going down, the primary cryptocurrency looks healthy than most global indices amid the coronavirus crisis. Bitcoin is slowly getting rid of the positive correlation to the markets, starting to stand still on its own, just like Gold in the financial crisis of 2008.
Total Market Cap: $184 billion
Bitcoin Market Cap: $120 billion
BTC Dominance Index: 65.8%
*Data by CoinGecko
Key Levels To Watch & Next Possible Targets
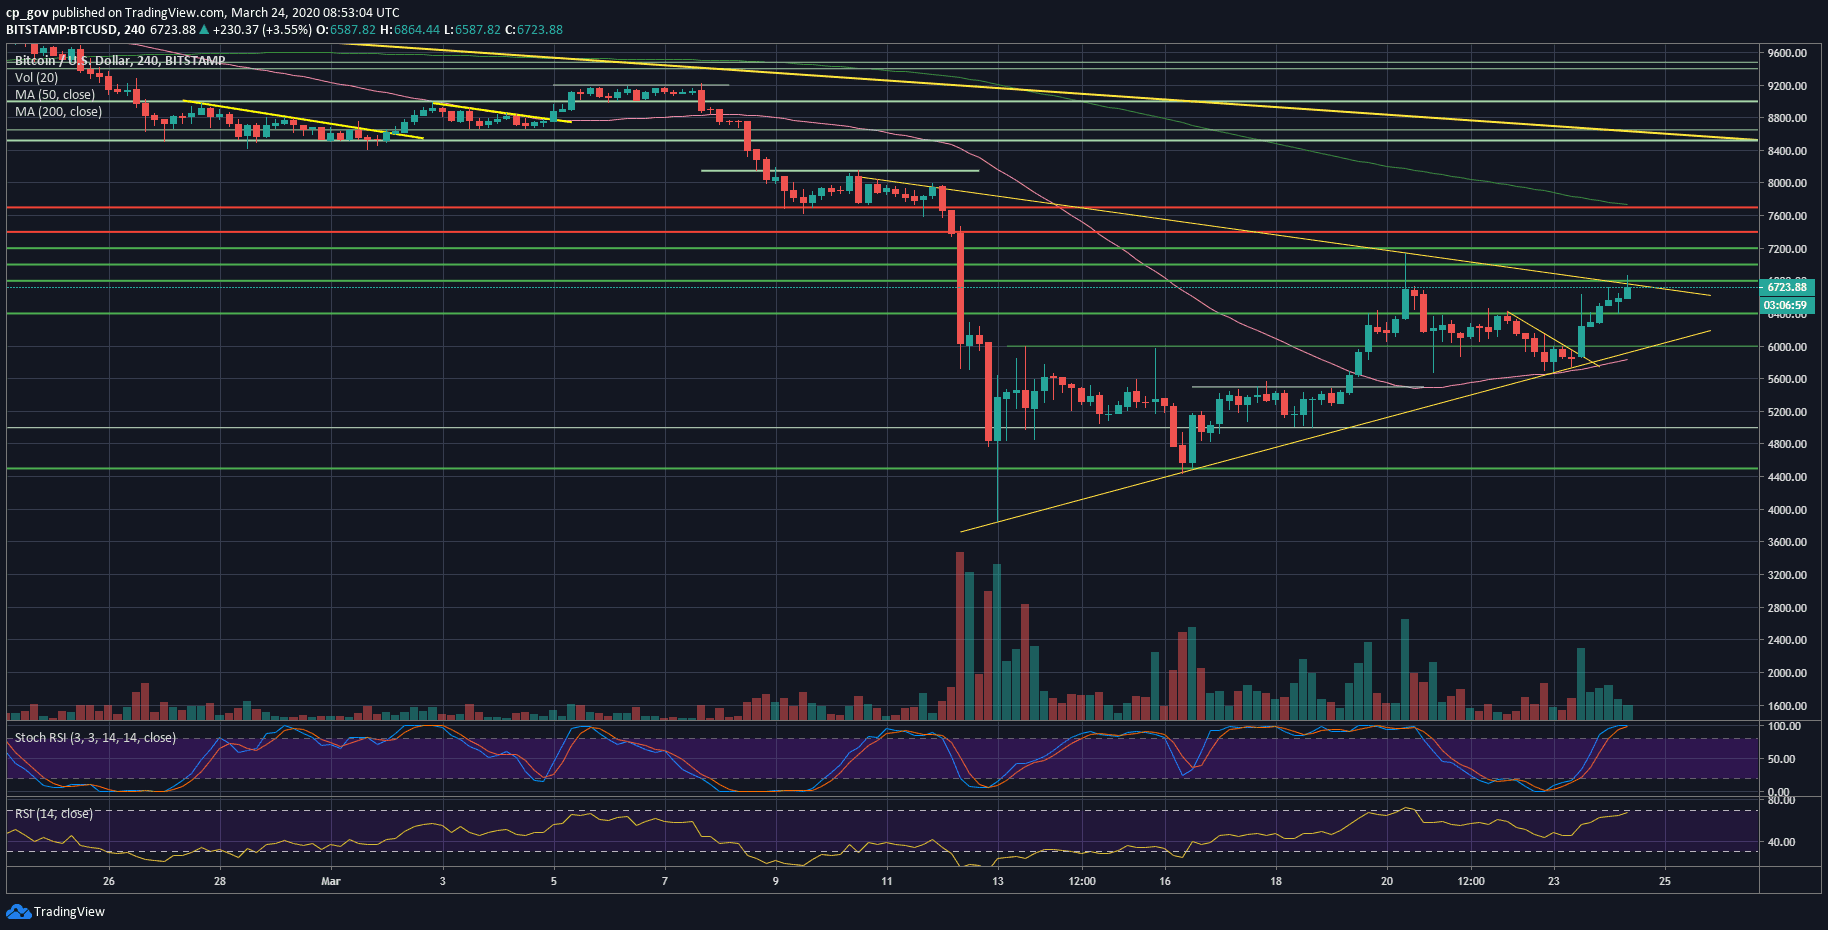
– Support/Resistance levels: Looking at the following 4-hour chart we can see that Bitcoin is forming a symmetrical triangle that has to reach its apex during the next day or two. A breakout will be likely to point out the future short-term direction for BTC.
As of now, the Bitcoin price is nearing the upper boundary of the triangle. The descending trend-line lies along with the next significant resistance level at $6800 – $6900.
In case of a breakout, then the next resistance level is likely to be the $6800, followed by the $7000 benchmark and the high from Thursday around $7140 – $7200, which is the Golden Fib level. Further above lies $7400 and $7700.
From below, the first level of support now lies at $6600, followed by the $6400 price zone. Further below lies the $6000 benchmark, followed by the mentioned above 4-hour MA-50 at $5850.
– The RSI Indicator: The bullish divergence played out well, as mentioned in our recent Bitcoin price analysis from two days ago. The smart money accumulated around the $6K level.
As of now, the RSI is facing the crucial resistance level of 46-50. Everything looks bullish for Bitcoin, but the RSI will have to create a higher high above the 50 levels in order to continue upwards.
Despite the above, the Stochastic RSI oscillator is about to make a cross-over at the overbought territory, which might lead to a correction shortly.
– Trading volume: Following a constant declining amount of volume over the past ten days, here comes the move, and it was bullish. It will be interesting to see how today’s volume candle will end.
BTC/USD BitStamp 4-Hour Chart
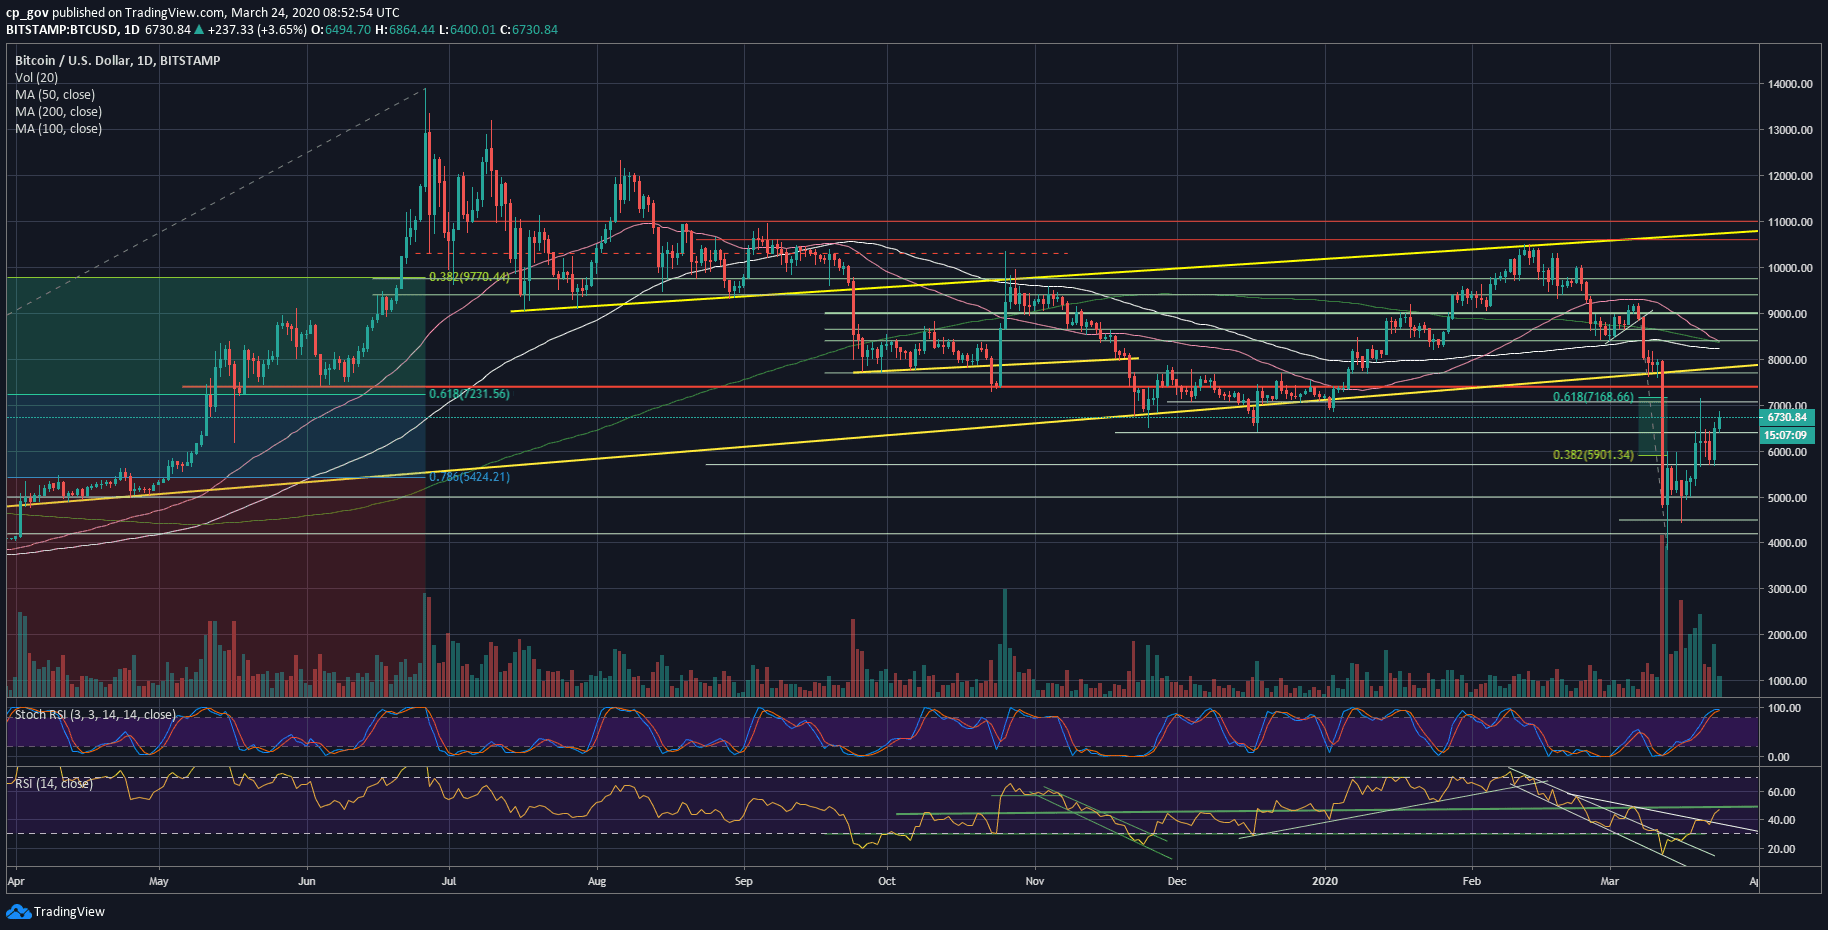
BTC/USD BitStamp 1-Day Chart