Over the past days, the Bitcoin price is seeing only one direction, which is in favor of the Bulls. The coin that was trading for 00 just five days ago is now aiming to re-target the K mark. However, will it be so easy?On our most recent BTC analysis from Friday, we pointed out a critical descending trend-line, which started forming once Bitcoin reached the K mark for the first time this month (May 7).On both the 4-hour and the following daily chart, you can see this line marked by yellow. As seen below, Bitcoin nicely reached up that line over the past several hours, for the fifth attempt over the past 24 days.However, the attempt quickly turned around and failed: Once Bitcoin reached over 00, the coin rapidly corrected down, and as of writing these lines, BTC is trading even
Topics:
Yuval Gov considers the following as important: Bitcoin (BTC) Price, BTC Analysis, btcusd, btcusdt
This could be interesting, too:
Mandy Williams writes Bitcoin ETFs Record Over .6B in Outflows in the Past 2 Weeks
Chayanika Deka writes Bitcoin Whales Offload 6,813 BTC as Selling Pressure Mounts
Wayne Jones writes Bitcoin Sentiment Hits 2022 Lows as Fear & Greed Index Falls to 10
Jordan Lyanchev writes Bitcoin Falls Below K for the First Time in 3 Months, How Much Lower Can It Go?
Over the past days, the Bitcoin price is seeing only one direction, which is in favor of the Bulls. The coin that was trading for $8600 just five days ago is now aiming to re-target the $10K mark. However, will it be so easy?
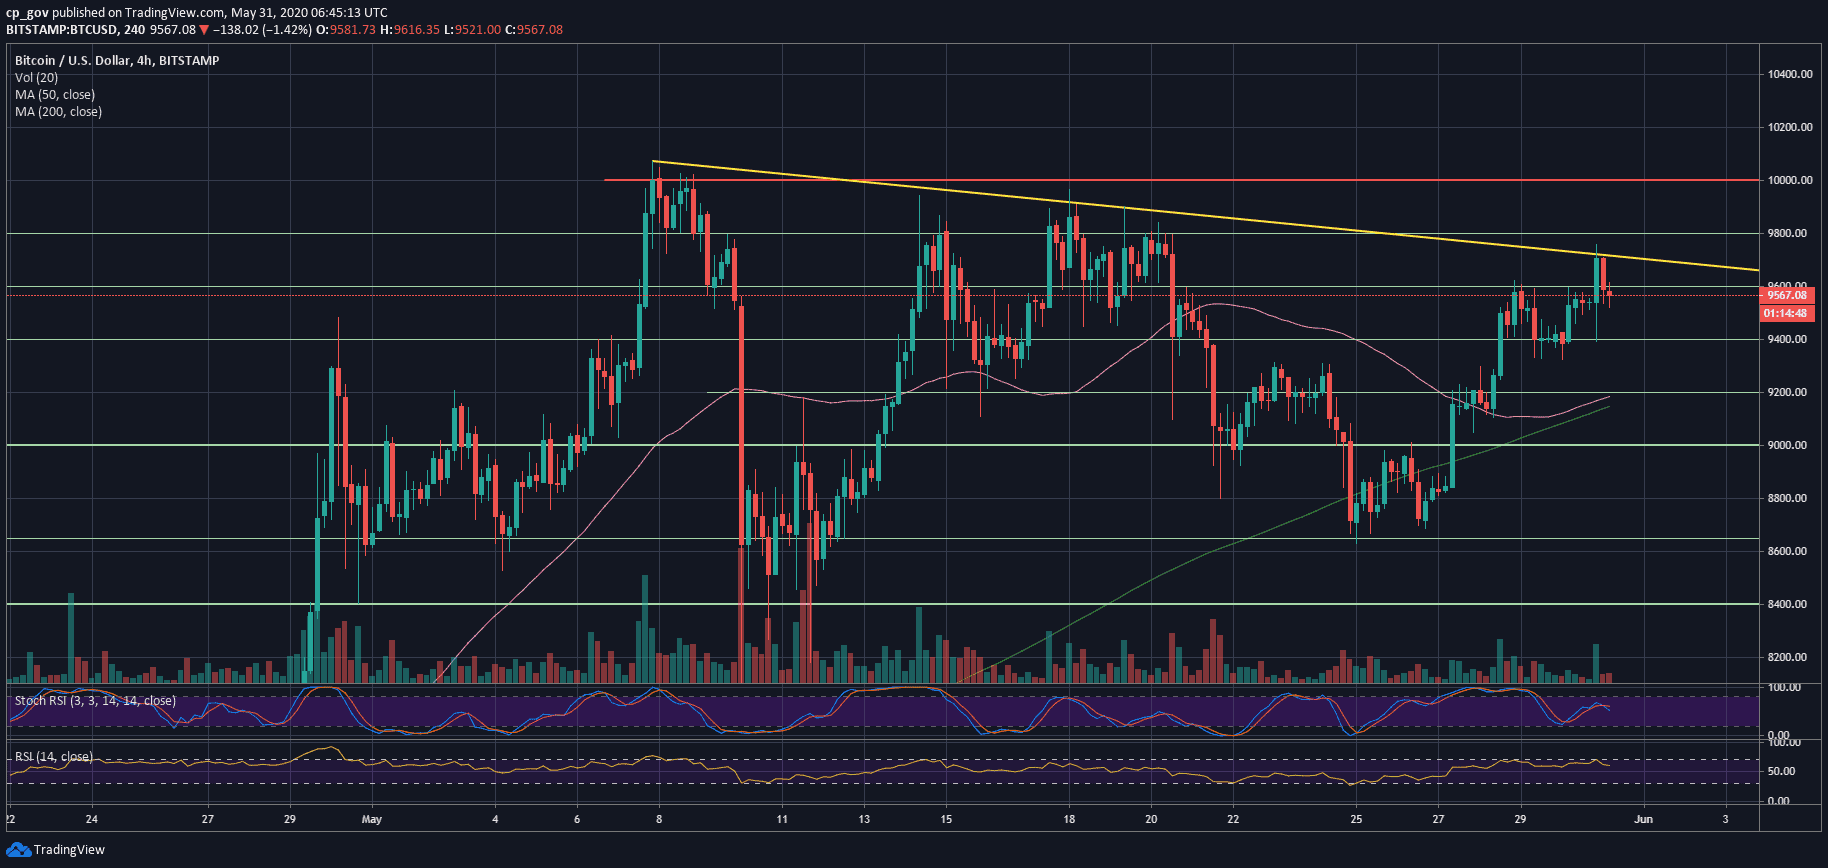
On our most recent BTC analysis from Friday, we pointed out a critical descending trend-line, which started forming once Bitcoin reached the $10K mark for the first time this month (May 7).
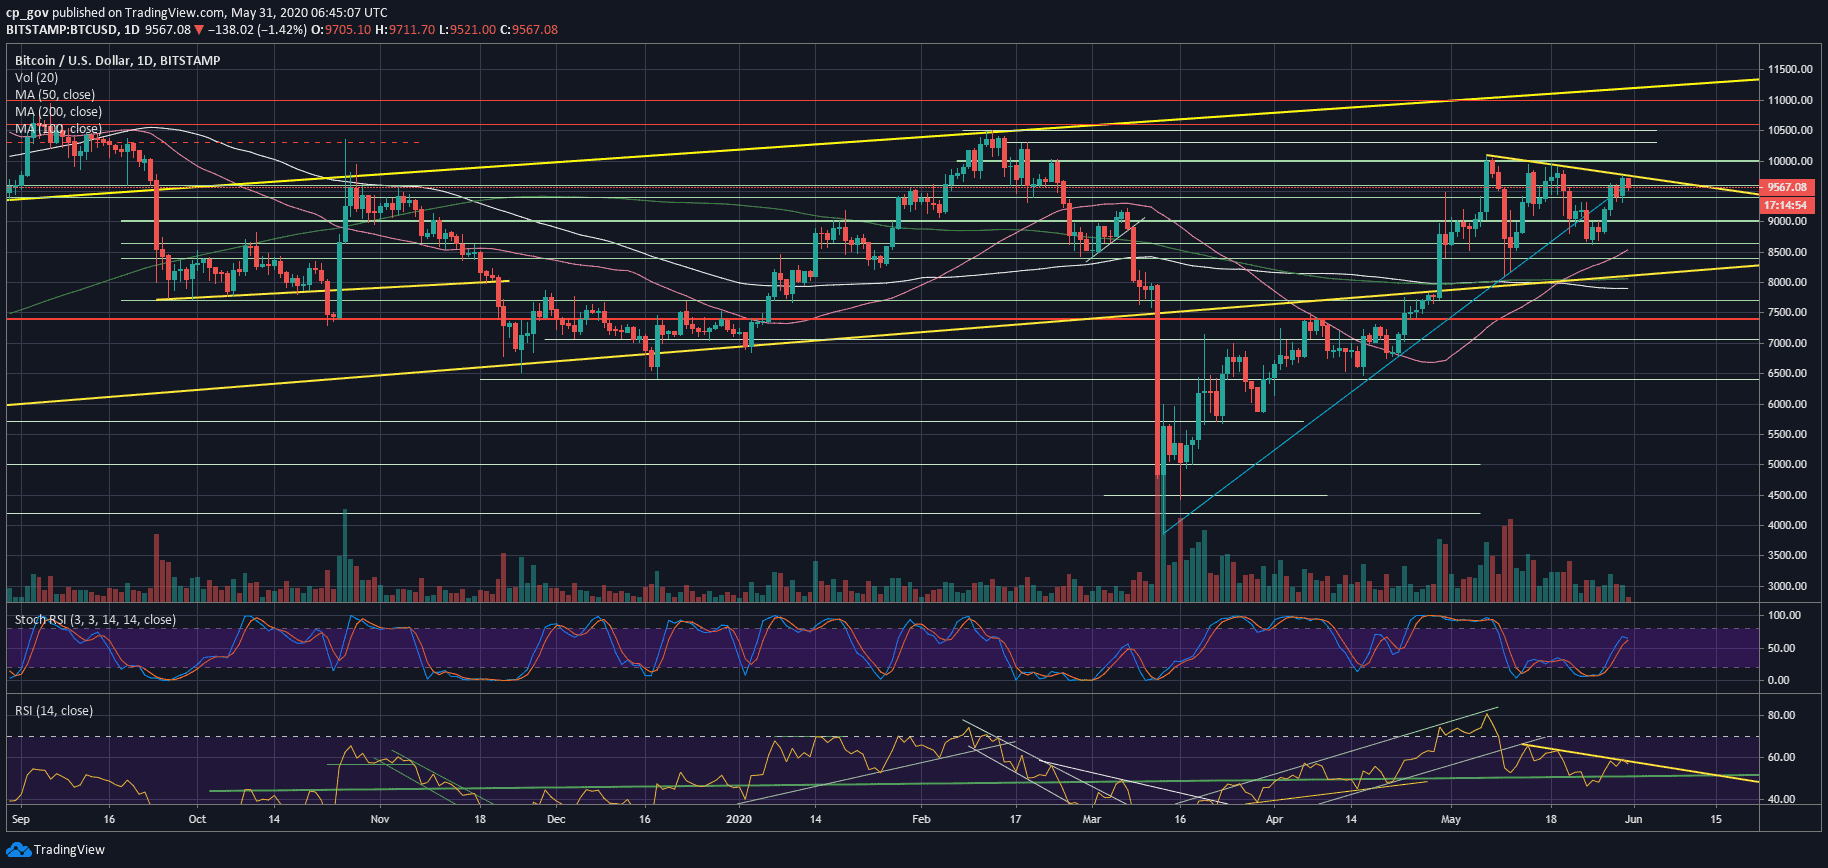
On both the 4-hour and the following daily chart, you can see this line marked by yellow. As seen below, Bitcoin nicely reached up that line over the past several hours, for the fifth attempt over the past 24 days.
However, the attempt quickly turned around and failed: Once Bitcoin reached over $9700, the coin rapidly corrected down, and as of writing these lines, BTC is trading even below $9600.
Was it the 5th and last attempt of this line, and from now on – Bitcoin will go down? Or is it only a matter of time until Bitcoin breaks it apart? Only time will tell.
Total Market Cap: $270 billion
Bitcoin Market Cap: $176.5 billion
BTC Dominance Index: 65.3%
*Data by CoinGecko
BTC/USD BitStamp 4-Hour Chart
BTC/USD BitStamp 1-Day Chart
The Technicals
Looking at the daily RSI, we can see the crucial indecisive spot reflected. As discussed here before, the RSI encountered a descending trend-line resistance at 58-60, corresponding to the price resistance line. A breakout of the price must receive a confirmation by the RSI.
Apart from this, the trading volume is relatively low, without any changes over the past week. This also indicates a significant upcoming move.
Bitcoin Short-term Support and Resistance Key Levels
As of writing these lines, the first level of resistance is again the $9600 zone, followed by the crucial descending trend-line around $9700 – $9750.
In case of a breakup, Bitcoin will likely check $9900 – $10,000 very quickly, once again. Remember – the more times Bitcoin tries out, the higher the chance the $10K will finally break. Further above lies $10,300 followed by $10,500.
From below, the first level of support now lies around $9400 – $9500. Further down lies the confluence zone at $9200 – $9300, followed by $9000.