A senior analyst at RoboForex shares his insights into the future scenarios for Bitcoin, Ethereum, Litecoin, EOS and Bitcoin Cash price movement.Dmitriy Gurkovskiy, a senior analyst at foreign exchange broker RoboForex, provides his vision of the possible tendencies in price changes for Bitcoin as well as for other major cryptos.The cryptocurrency market is actively correcting but the current movement is looking more like a rebound before a new wave to the downside. However, in the chart of several digital assets, there are patterns in favor of growth, for example, the daily chart of Litecoin, where the forming pattern indicates a possible rising movement to break , that’s why another decline and test of the lows won’t probably force the price to continue falling. On the contrary, this
Topics:
Dmitriy Gurkovskiy considers the following as important: bch, bchusd, Bitcoin Cash, BTC, btcusd, crypto analysis, crypto price, crypto price analysis, Currencies, dmitriy gurkovskiy, eosusd, ETH, ethusd, Guest Posts, LTC, ltcusd, News, Reports, roboforex
This could be interesting, too:
Christian Mäder writes Bitcoin-Transaktionsgebühren auf historischem Tief: Warum jetzt der beste Zeitpunkt für günstige Überweisungen ist
Bitcoin Schweiz News writes Litecoin jetzt in der Telegram-Wallet verfügbar!
Christian Mäder writes Das Bitcoin-Reserve-Rennen der US-Bundesstaaten: Wer gewinnt das Krypto-Wettrüsten?
Chayanika Deka writes Why Arthur Hayes Is Bullish on Bitcoin Under Trump’s Economic Strategy
A senior analyst at RoboForex shares his insights into the future scenarios for Bitcoin, Ethereum, Litecoin, EOS and Bitcoin Cash price movement.
Dmitriy Gurkovskiy, a senior analyst at foreign exchange broker RoboForex, provides his vision of the possible tendencies in price changes for Bitcoin as well as for other major cryptos.
The cryptocurrency market is actively correcting but the current movement is looking more like a rebound before a new wave to the downside. However, in the chart of several digital assets, there are patterns in favor of growth, for example, the daily chart of Litecoin, where the forming pattern indicates a possible rising movement to break $90, that’s why another decline and test of the lows won’t probably force the price to continue falling. On the contrary, this decline will help to complete the current patterns and make the instrument start a new growth. Unfortunately, shorter timeframes do not confirm active growth yet, which means that bears may be preparing for an attack.
Bitcoin
In the daily chart, bulls continue testing an important resistance area. They managed to keep the price inside the descending channel, but if the instrument breaks its downside border and fixes below $4,000, the asset may plunge. At the moment, there are chances to see further growth with the target at $9,275. A signal to confirm this scenario is a breakout of the descending trendline at the RSI. Also, on the indicator chart, there is a potential of formation of a Head & Shoulders reversal pattern, which may also indicate a further growth. However, if the price plummets and tests $4,195, the instrument may for a Double Bottom reversal pattern. The bullish scenario may no longer be valid if the instrument fixes below $4,000.
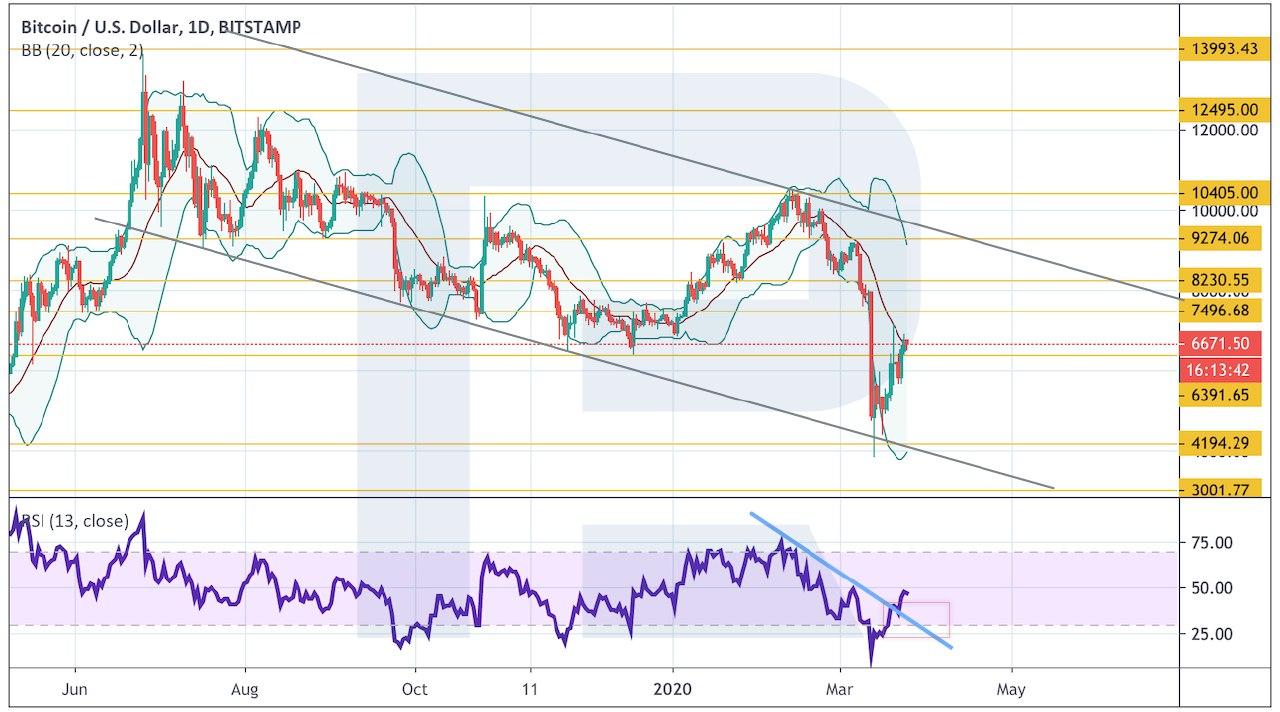
Photo: Roboforex / TradingView
As we can see in the H4 chart, Bitcoin is also testing the resistance area at $6,995. The fact that the price has broken the descending channel is very positive and indicates a possible further growth. At the moment, the pair may yet correct towards $5,725 and then start the above-mentioned growth. A good signal to confirm a new rising movement is a test of the support line at the RSI, as well as a breakout of the upside border of a Triangle pattern. However, this scenario may no longer be valid if the instrument breaks $5,650. In this case, the asset may try to test the support area close to $4,195 again.
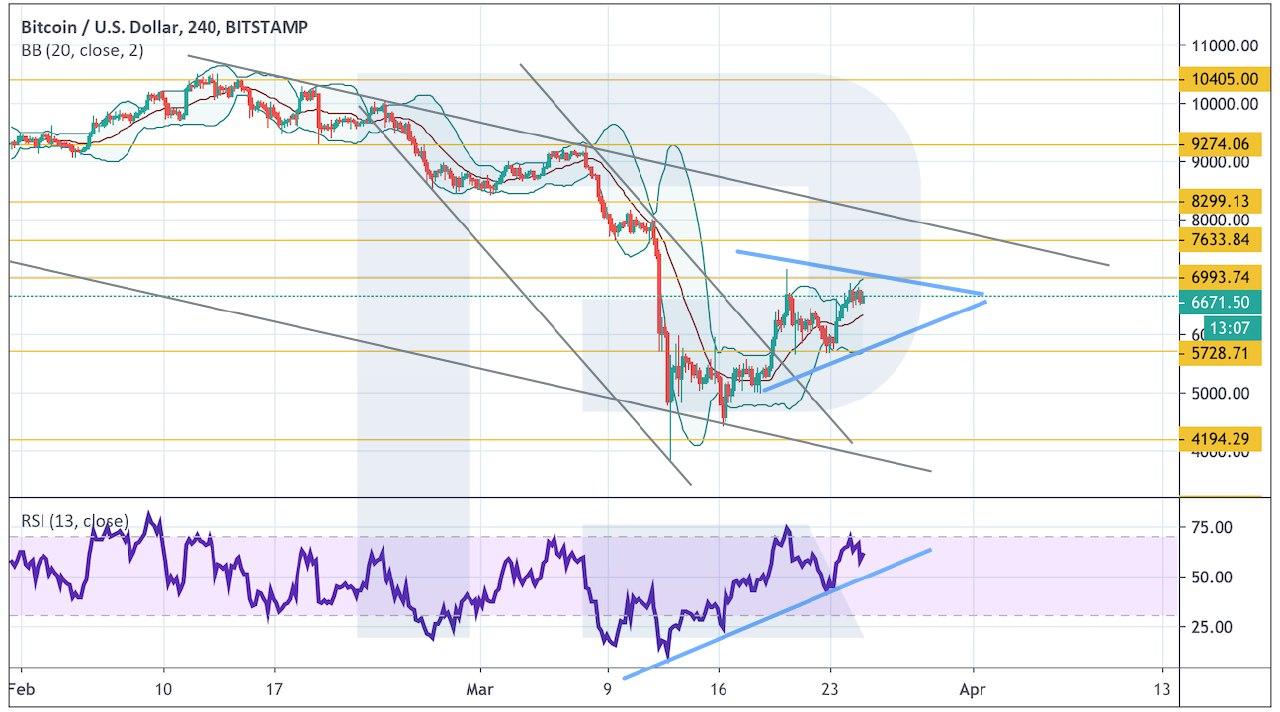
Photo: Roboforex / TradingView
Ethereum
In the daily chart, Ethereum is also testing another resistance area. Moving Averages have already crossed in favor of a bearish trend. In most cases, the price returns to the area between Moving Averages after the start of a new tendency, that’s why there is a potential of growth towards $180. Another signal to confirm this scenario is a breakout of the descending trendline at the RSI. Such breakout indicates a test of a similar line in the price chart. However, this scenario may be canceled if the instrument breaks the descending channel’s downside border and fixes below $80. In this case, the asset is expected to continue falling with the target at $50.
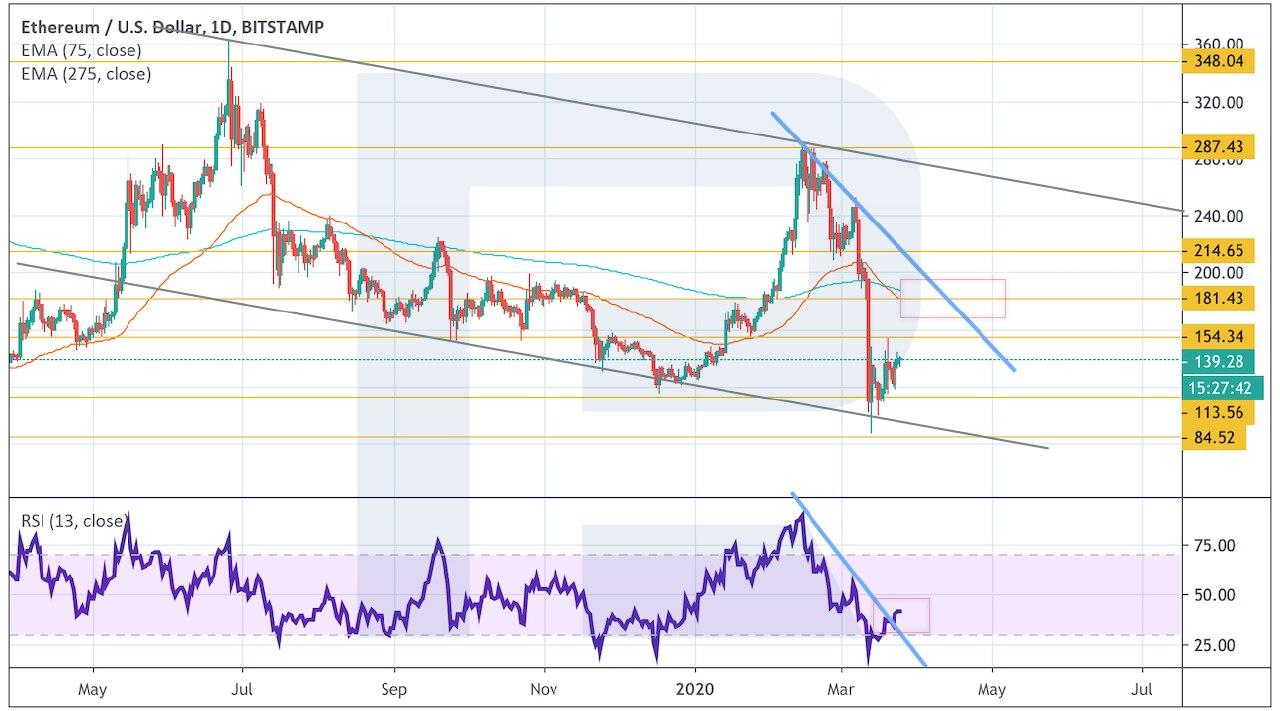
Photo: Roboforex / TradingView
On shorter timeframes, the asset is no longer moving inside the descending channel. However, the price is still rebounding from Moving Averages, thus indicating a bearish pressure. To confirm a growth with the target at $180, the price must break the resistance level and fix above $155. Still, the bullish scenario may be no longer valid if the instrument breaks the support area and fixes below $113. In this case, the asset may continue falling with the first target at $84.
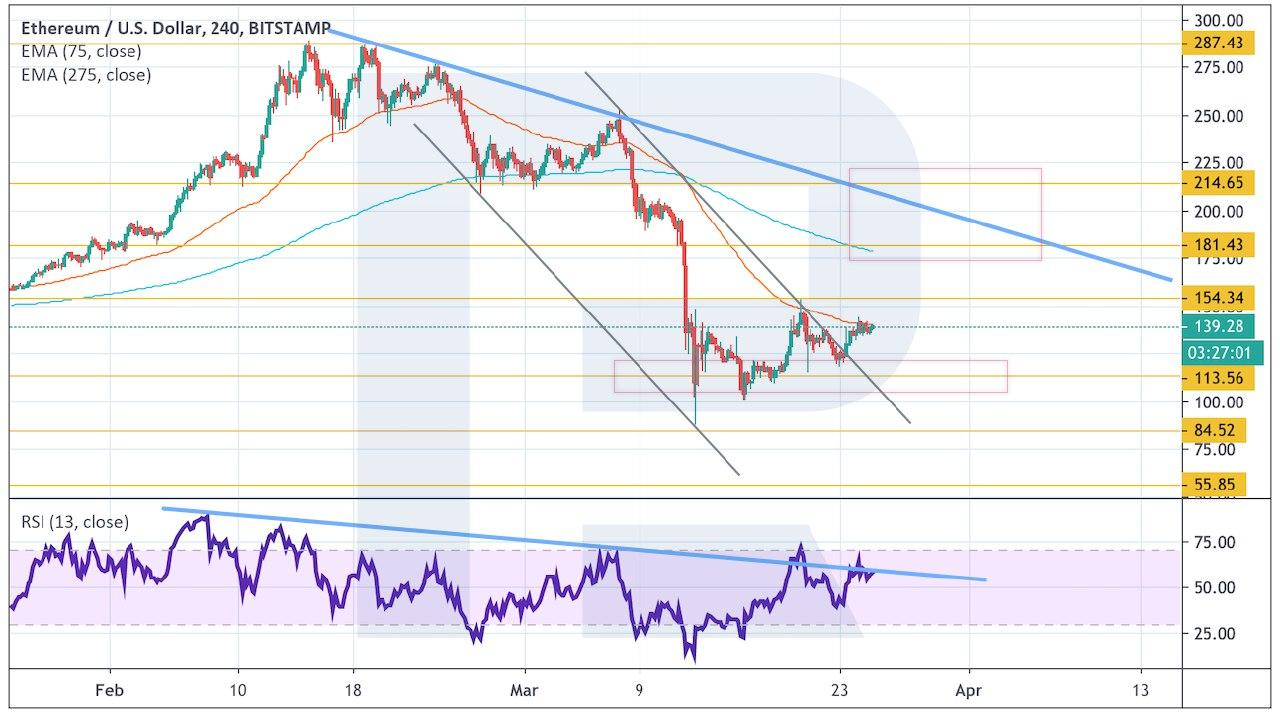
Photo: Roboforex / TradingView
Litecoin
In the daily chart, the asset continues forming a “Wolfe Wave” ascending pattern with the target above $95. A strong signal to confirm a growth is a breakout of the descending channel’s upside border to fix above. The resistance line at the RSI has already been broken, which indicates a test of $47 in the nearest future. However, the bullish scenario may be no longer valid if the instrument plunges and breaks $21. In this case, bulls won’t be able to prevent the asset from falling towards $15.
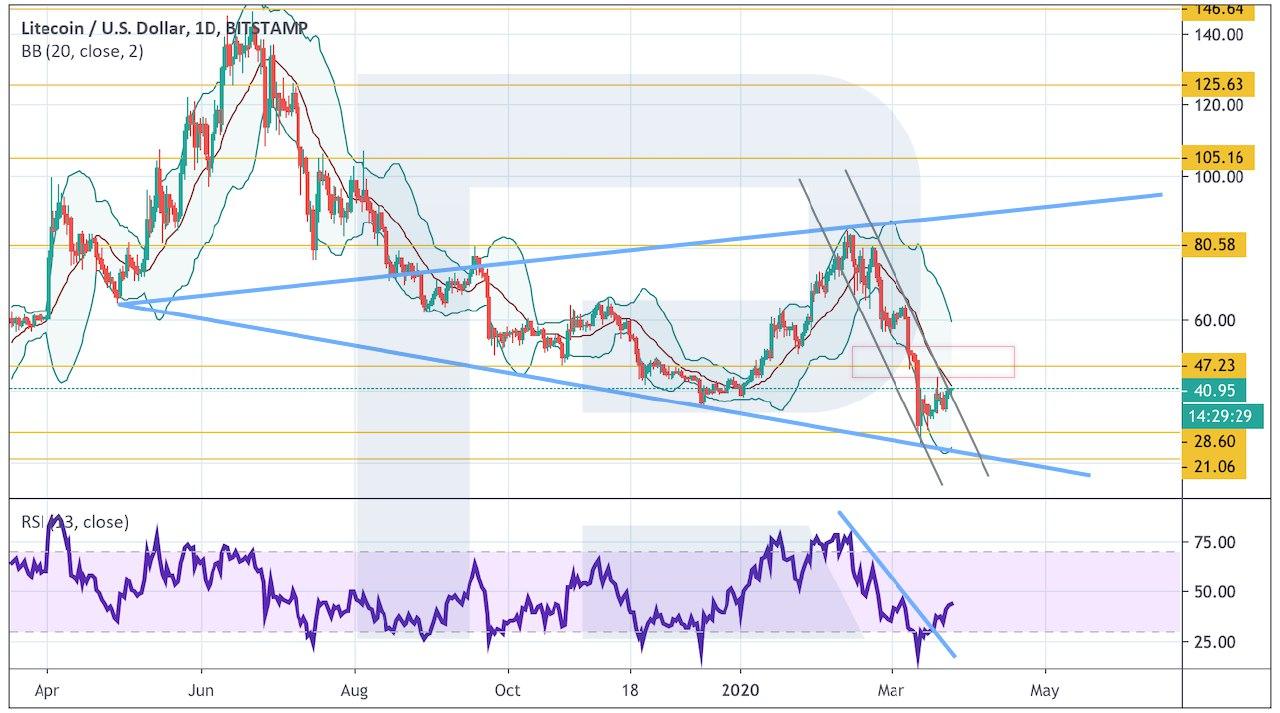
Photo: Roboforex / TradingView
As we can see in the H4 chart, Litecoin is testing the upside border of the Bollinger Bands indicator. In addition to that, the price has already rebounded from the indicator’s downside border twice. Such behavior indicates a rising impulse and there are chances to see a breakout of the resistance area and a further growth towards $55. A good signal to confirm this scenario is a breakout of the trendline at the RSI. However, this scenario may be canceled if the price falls and breaks $28. In this case, the asset may continue trading downwards with the target at $20.
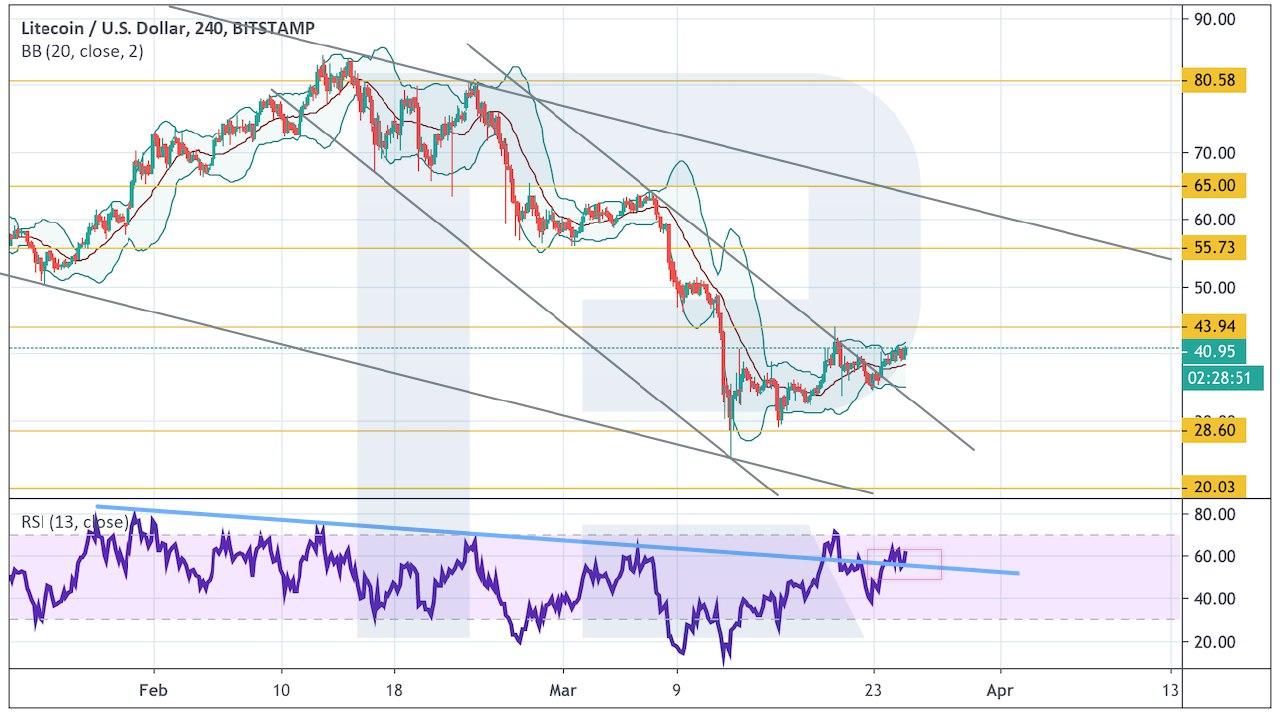
Photo: Roboforex / TradingView
EOS
In the daily chart, bulls are trying to push the price back to the closest resistance level. Also, the asset has rebounded from the local lows. At the RSI, there is a potential of formation of a Head & Shoulders reversal pattern. If bulls fail to break the resistance area and the asset returns to $1.45, the price may form a Double Bottom reversal pattern. The target of this pattern, in case of a breakout of $2.87, will be at $4.00. However, the bullish scenario may be canceled if the instrument breaks $1.05. in this case, the downtrend will continue.
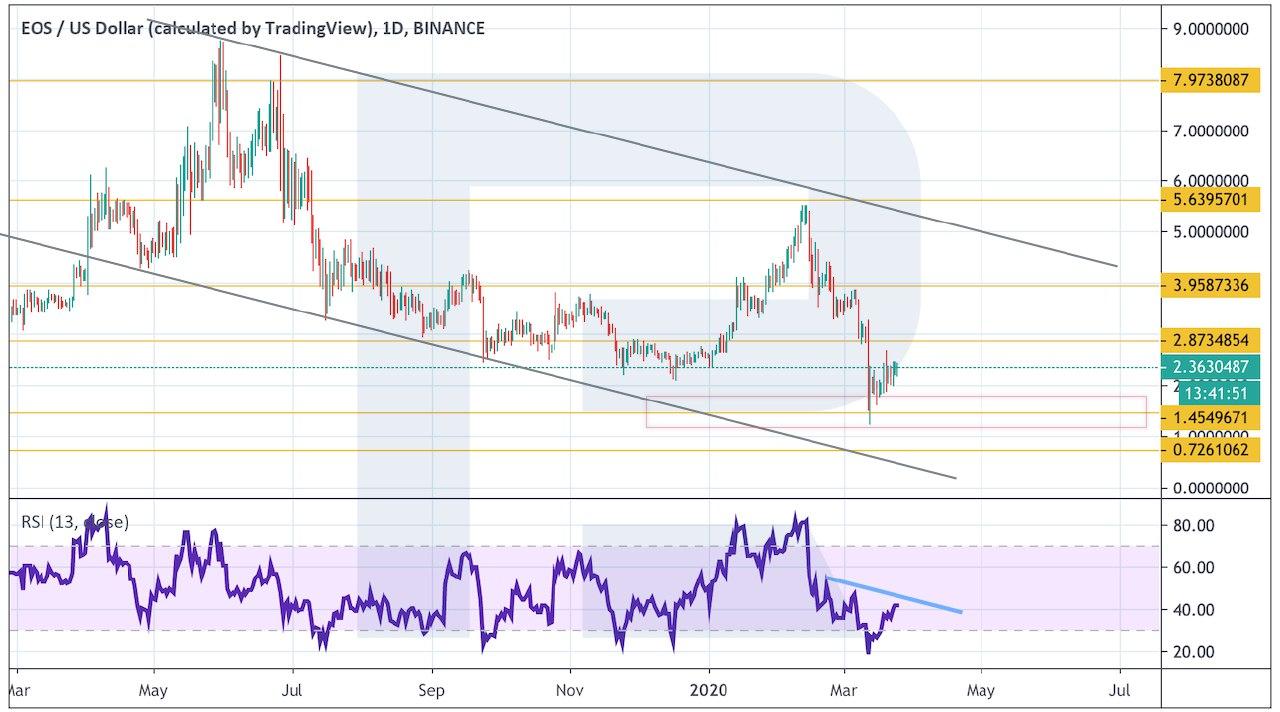
Photo: Roboforex / TradingView
On shorter timeframes, the asset is no longer trading inside the descending channel and that’s the first sign that the decline may be over. If the price breaks the resistance level and fixes above $2.65, it may continue growing with the first target at $3.25. Another signal to confirm this scenario is a rebound from the trendline at the RSI. However, this scenario may be no longer valid if the instrument breaks $1.66. in this case, the bearish tendency will continue.
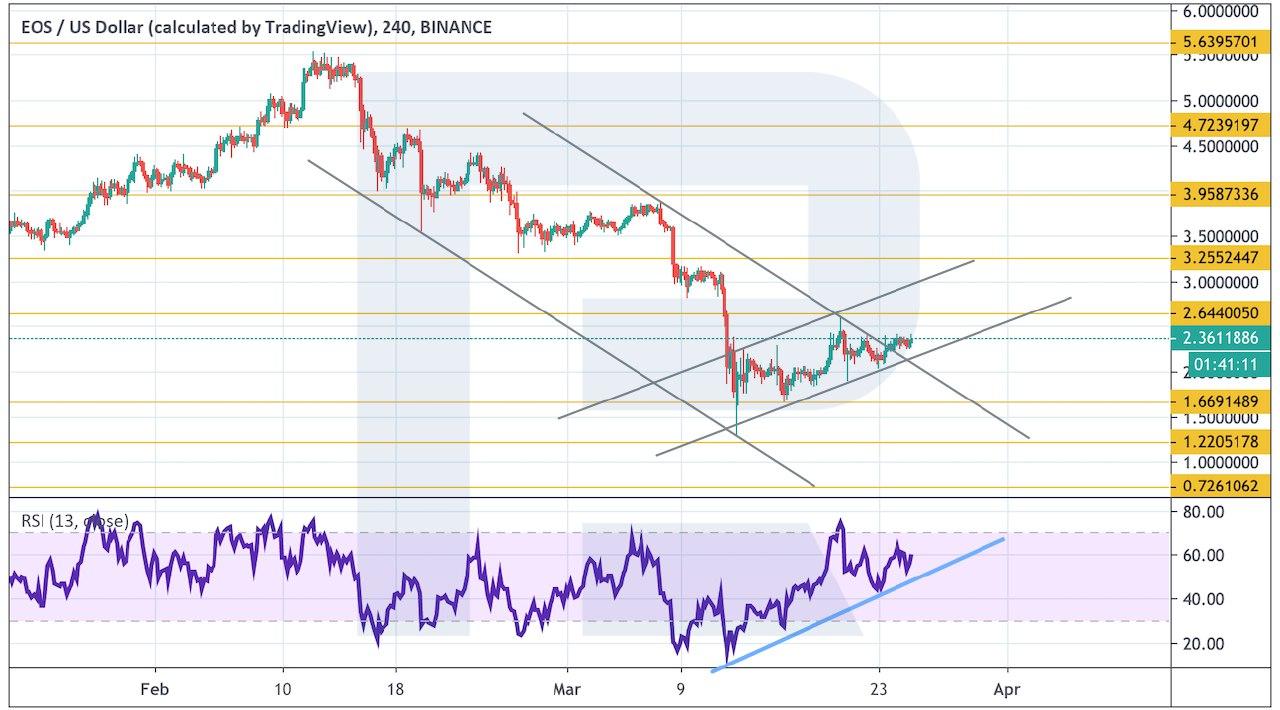
Photo: Roboforex / TradingView
Bitcoin Cash
In the daily chart, bulls managed to test the resistance level. At the moment, there is a potential of a formation of a Wolfe Wave bullish pattern. To complete the pattern, the instrument must fall to test $120. After that, the asset may start a new growth towards $358. A signal to confirm this scenario is a breakout of the resistance line in the H4 chart and finish a Head & Shoulders reversal pattern at the RSI. Still, this scenario may be canceled if the pair breaks the support area and fixes below $115.
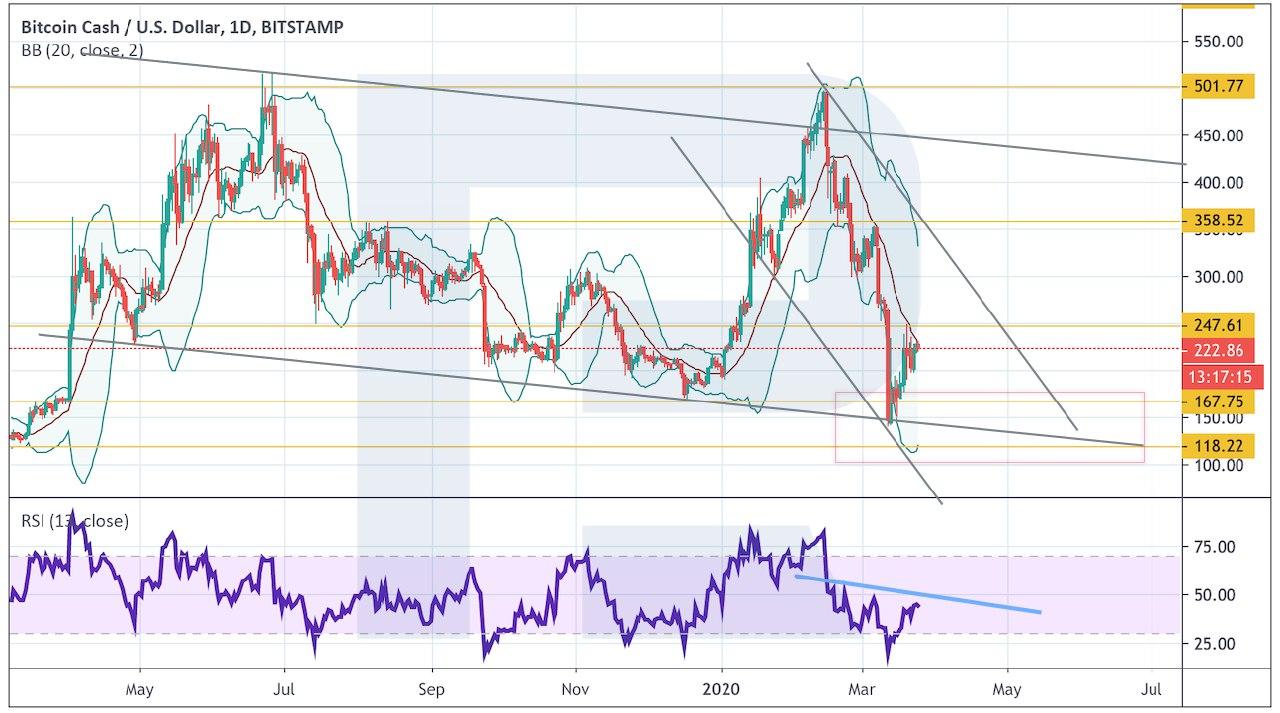
Photo: Roboforex / TradingView
As we can see in the H4 chart, the asset is testing the resistance line. If the price breaks the line and fixes above $250, it may continue growing towards $295. At the moment, there are chances to see a further decline to reach $120. A signal to confirm the bearish scenario is rebound from the resistance line at the RSI and a breakout of the support area to fix below $190.
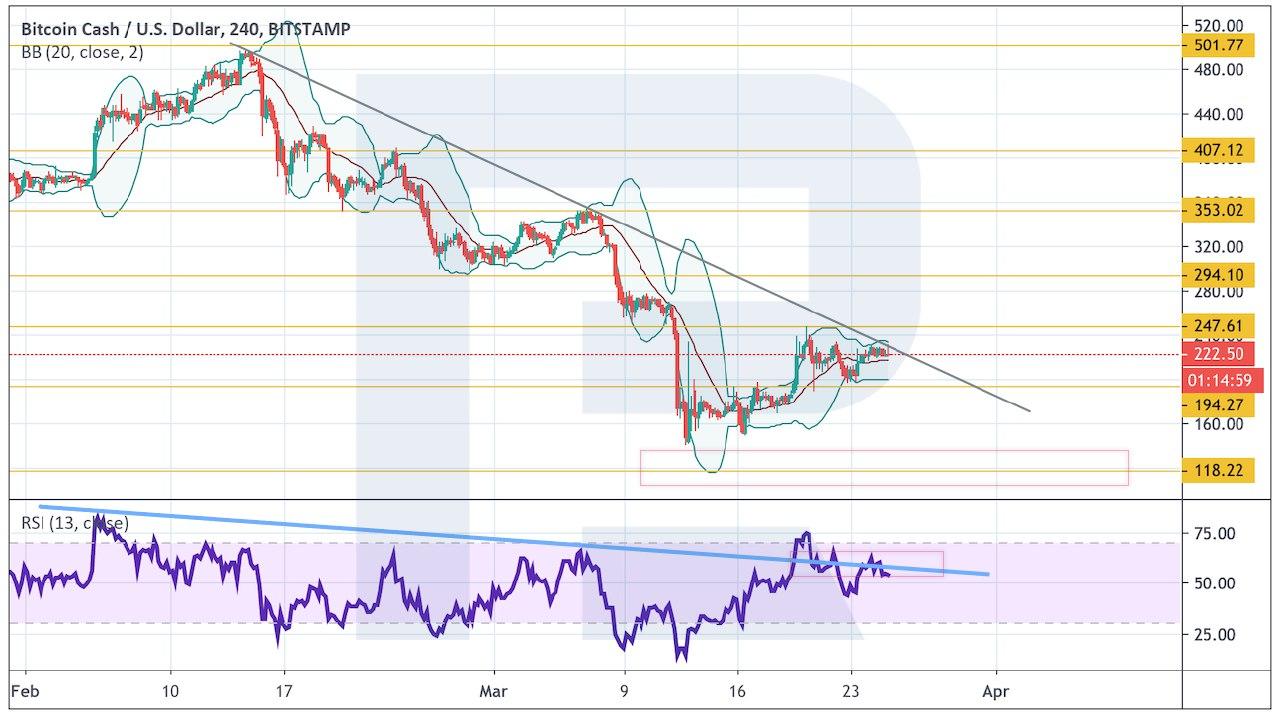
Photo: Roboforex / TradingView
Disclaimer: Any predictions contained herein are based on the authors' particular opinion. This analysis shall not be treated as trading advice. RoboForex shall not be held liable for the results of the trades arising from relying upon trading recommendations and reviews contained herein.

Dmitriy Gurkovskiy is a senior analyst at RoboForex, an award-winning European online foreign exchange forex broker.