Bitcoin has just broken above its previous all-time high of ,660 on Bitstamp exchange (white dashed line) and is now storming towards the psychological ,000 level. This is a truly historical moment to behold and has taken the leading asset just under 3 years to fully recuperate the losses from the extreme 2018 bear market.New buying pressure from the US trading session is helping to maintain the surging momentum from this weekend, with the global crypto market capital now quickly approaching the 0 billion mark on Coinmarketcap.With Bitcoin now in price discovery, everyone is thinking the same thing. Where is BTC going now?Price to Levels to Watch in the Short-termOn the daily BTC/USD chart, we can see that prices are now surging towards the first set of new Fibonacci extension
Topics:
Ollie Leech considers the following as important: Bitcoin (BTC) Price, BTC Analysis, BTCEUR, BTCGBP, btcusd, btcusdt
This could be interesting, too:
Chayanika Deka writes XRP, SOL, and ADA Inclusion in US Crypto Reserve Pushes Traders on Edge
Chayanika Deka writes Why Arthur Hayes Is Bullish on Bitcoin Under Trump’s Economic Strategy
Mandy Williams writes Why the Bitcoin Market Is Stuck—and the Key Metric That Could Change It: CryptoQuant CEO
Wayne Jones writes Metaplanet Acquires 156 BTC, Bringing Total Holdings to 2,391
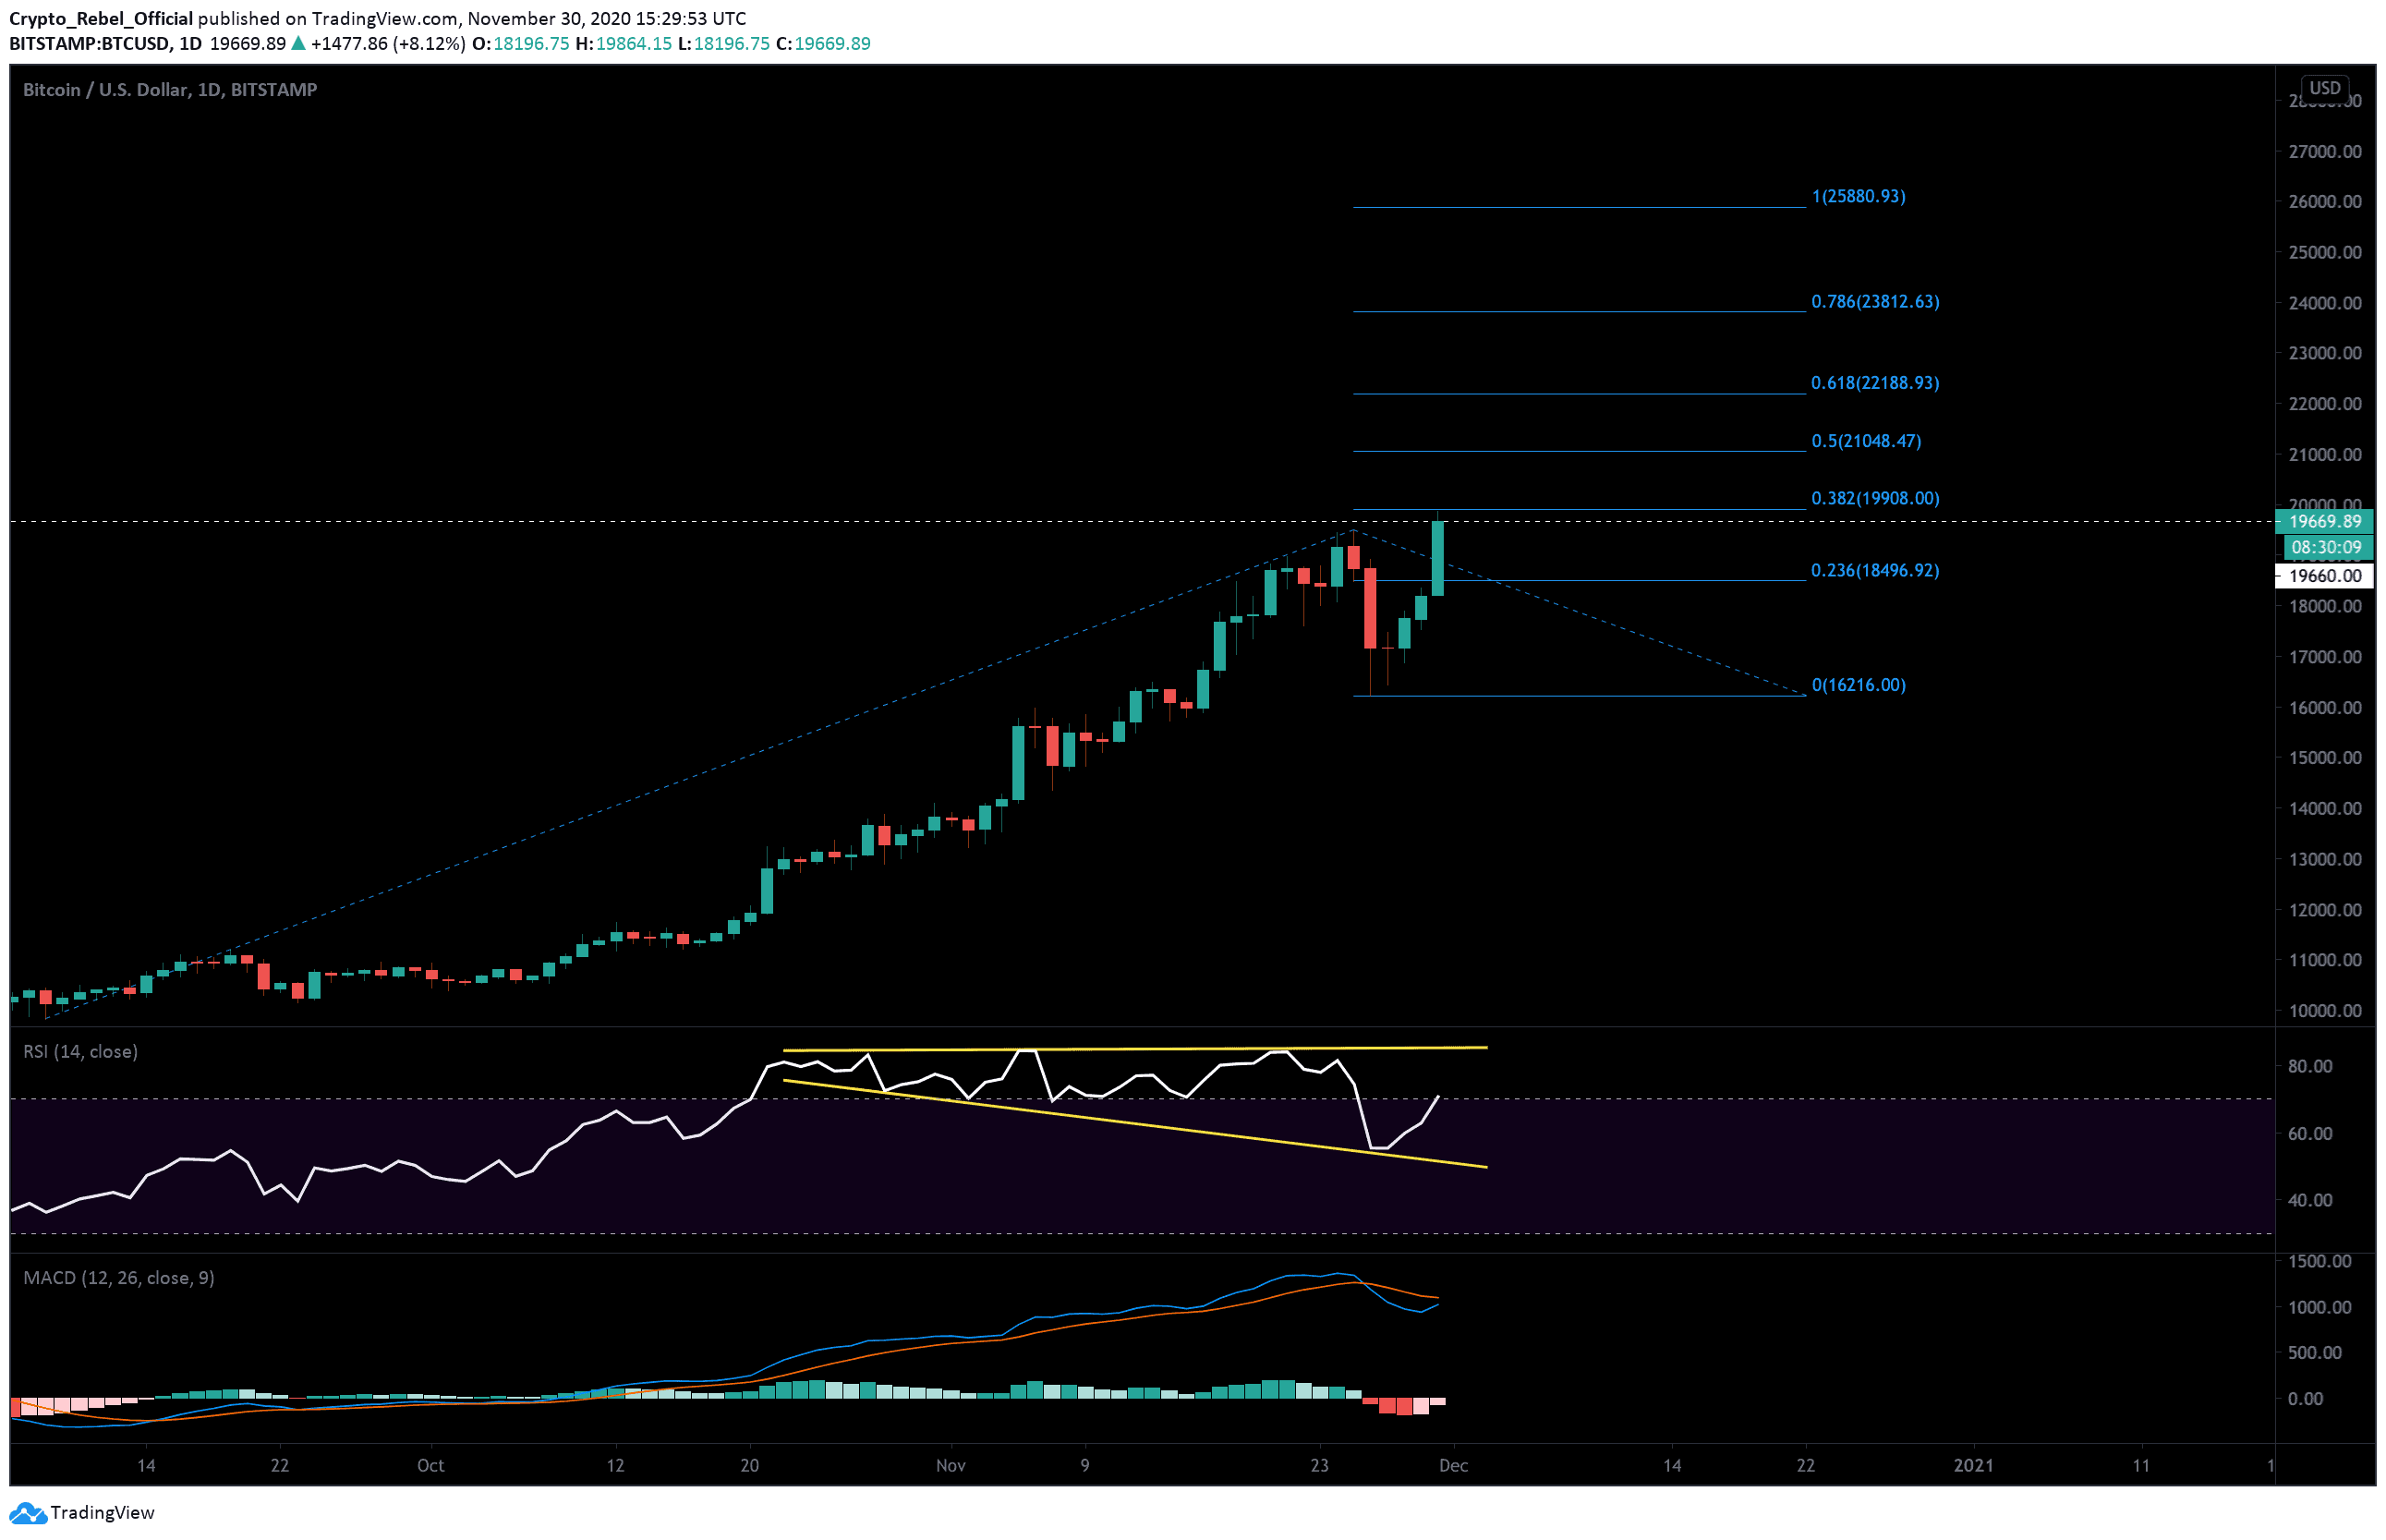
Bitcoin has just broken above its previous all-time high of $19,660 on Bitstamp exchange (white dashed line) and is now storming towards the psychological $20,000 level. This is a truly historical moment to behold and has taken the leading asset just under 3 years to fully recuperate the losses from the extreme 2018 bear market.
New buying pressure from the US trading session is helping to maintain the surging momentum from this weekend, with the global crypto market capital now quickly approaching the $580 billion mark on Coinmarketcap.
With Bitcoin now in price discovery, everyone is thinking the same thing. Where is BTC going now?
Price to Levels to Watch in the Short-term
On the daily BTC/USD chart, we can see that prices are now surging towards the first set of new Fibonacci extension levels (blue lines). These levels are created by finding out the Fibonnaci retracement levels from between the lowest low of the current trend and the previous highest high, and then by projecting them from the next lowest low (see blue dashed line).
This gives us the following targets where we may see the next areas of resistance as Bitcoin breaks into new territory.
(1) $19,908
(2) 21,048
(3) 22,188
(4) 23,812
If the current trend reverses, however, and big money starts to sell into this surging buying pressure, then we should expect to see possible correction levels around the following support zones:
(1) $19,440
(2) $18,791 – $18,700
(3) $18,240 – $18,150
Looking at the daily indicators, we can see that the MACD is now decidedly bullish with the two moving average now about to converge after breaking apart 5 days ago. Volume on the MACD histogram is also about to flip bullish too as more investment continues to flow into the asset.
In order to shake off the current descending trend on the RSI (lower yellow line), we would like to see a new higher high print on the chart at the daily close.
Total market capital: $589 billion
Bitcoin market capital: $364 billion
Bitcoin dominance: 61.9%
*Data by Coingecko.
Bitstamp BTC/USD Daily Chart