Bitcoin price has just surged by ,300 in the last few hours, taking it 0 beyond the previous all-time high of ,990. This is the highest price Bitcoin has ever been across all exchange platforms and has happened just as the American trading session got underway.In the last analysis, we predicted that the prior drop in volatility could have been a sign of an early accumulation before a new big move, and it turns out this was exactly what was happening. billion has flooded into the market during this latest price movement and pushed the global market capital within inches of 0 billion. This is the highest it’s been since January 30th, 2018 – over 1,052 days ago! This new uptrend has also caused a significant short squeeze and liquidated almost 0 million short positions on
Topics:
Ollie Leech considers the following as important: Bitcoin (BTC) Price, BTC Analysis, BTCEUR, BTCGBP, btcusd, btcusdt
This could be interesting, too:
Chayanika Deka writes XRP, SOL, and ADA Inclusion in US Crypto Reserve Pushes Traders on Edge
Chayanika Deka writes Why Arthur Hayes Is Bullish on Bitcoin Under Trump’s Economic Strategy
Mandy Williams writes Why the Bitcoin Market Is Stuck—and the Key Metric That Could Change It: CryptoQuant CEO
Wayne Jones writes Metaplanet Acquires 156 BTC, Bringing Total Holdings to 2,391
Bitcoin price has just surged by $1,300 in the last few hours, taking it $780 beyond the previous all-time high of $19,990. This is the highest price Bitcoin has ever been across all exchange platforms and has happened just as the American trading session got underway.
In the last analysis, we predicted that the prior drop in volatility could have been a sign of an early accumulation before a new big move, and it turns out this was exactly what was happening.
$24 billion has flooded into the market during this latest price movement and pushed the global market capital within inches of $600 billion. This is the highest it’s been since January 30th, 2018 – over 1,052 days ago! This new uptrend has also caused a significant short squeeze and liquidated almost $400 million short positions on major exchanges.
Can BTC hold on to this new price point?
Price Levels to Watch in the Short-term
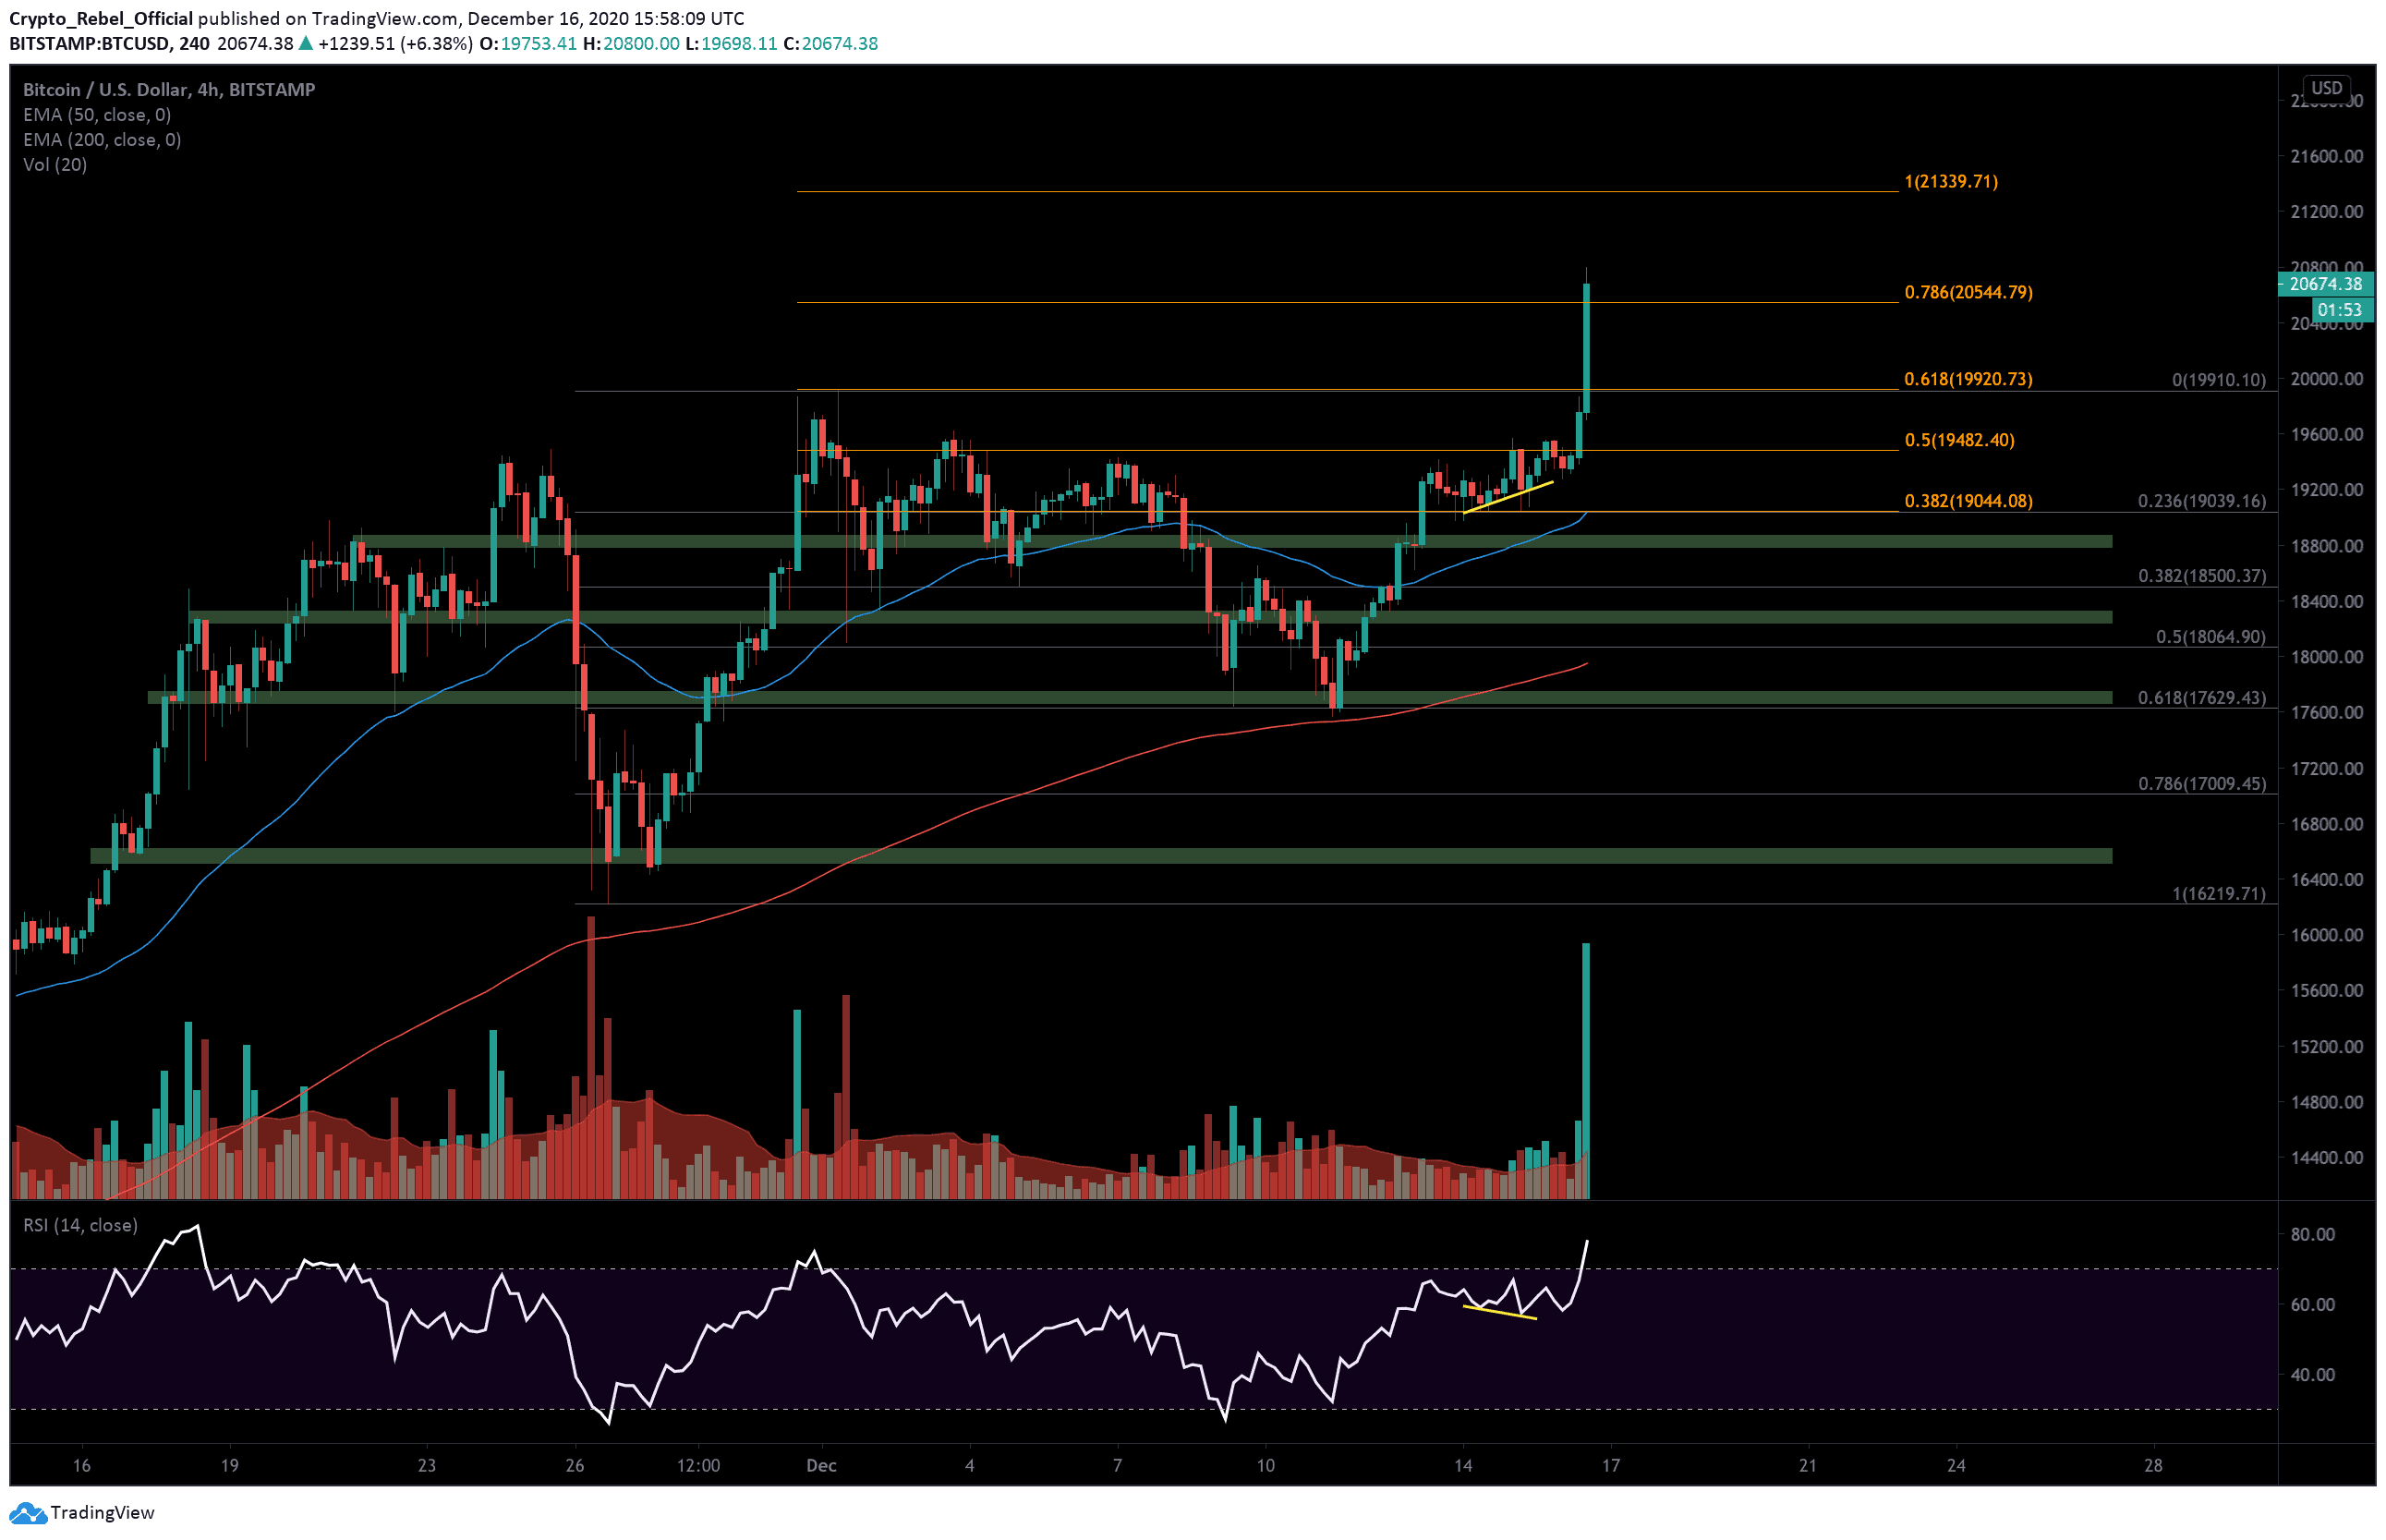
On the 4-hour BTC/USD chart, we can see that the Bitcoin price action is now clear of the 0.786 Fibonacci extension level at $20,544 and currently experiencing strong selling pressure at the $20,600 level.
It’s possible that we might see bullish traders use this key Fibonacci level as support to recharge on before launching a second attempt at breaking this new resistance.
The next likely target above this current area is the psychological $21,000 level, which might see Bitcoin prices wick slightly over this line before correcting back down. It’s difficult to say at this moment if the current rally will sustain as all indicators have now flipped bullish, but with any significant uptrend, we should always anticipate some pullback. There are also two substantial CME gaps between $17,000 – $19,100 that will be having a negative impact on Bitcoin prices over the short-term.
If the current uptrend loses momentum and prices begin to cascade back down, then we should expect the following levels to act as supports:
(1) $20,544 – 0.786 Fibonacci Extension level.
(2) $20,200 – hourly wick low.
(3) $19,800 – $19,750 – order block support zone.
Total market capital: $607 billion.
Bitcoin market capital: $383 billion.
Bitcoin dominance: 63.2%
*Data by Coingecko.
Bitstamp BTC/USD 4-Hour Chart