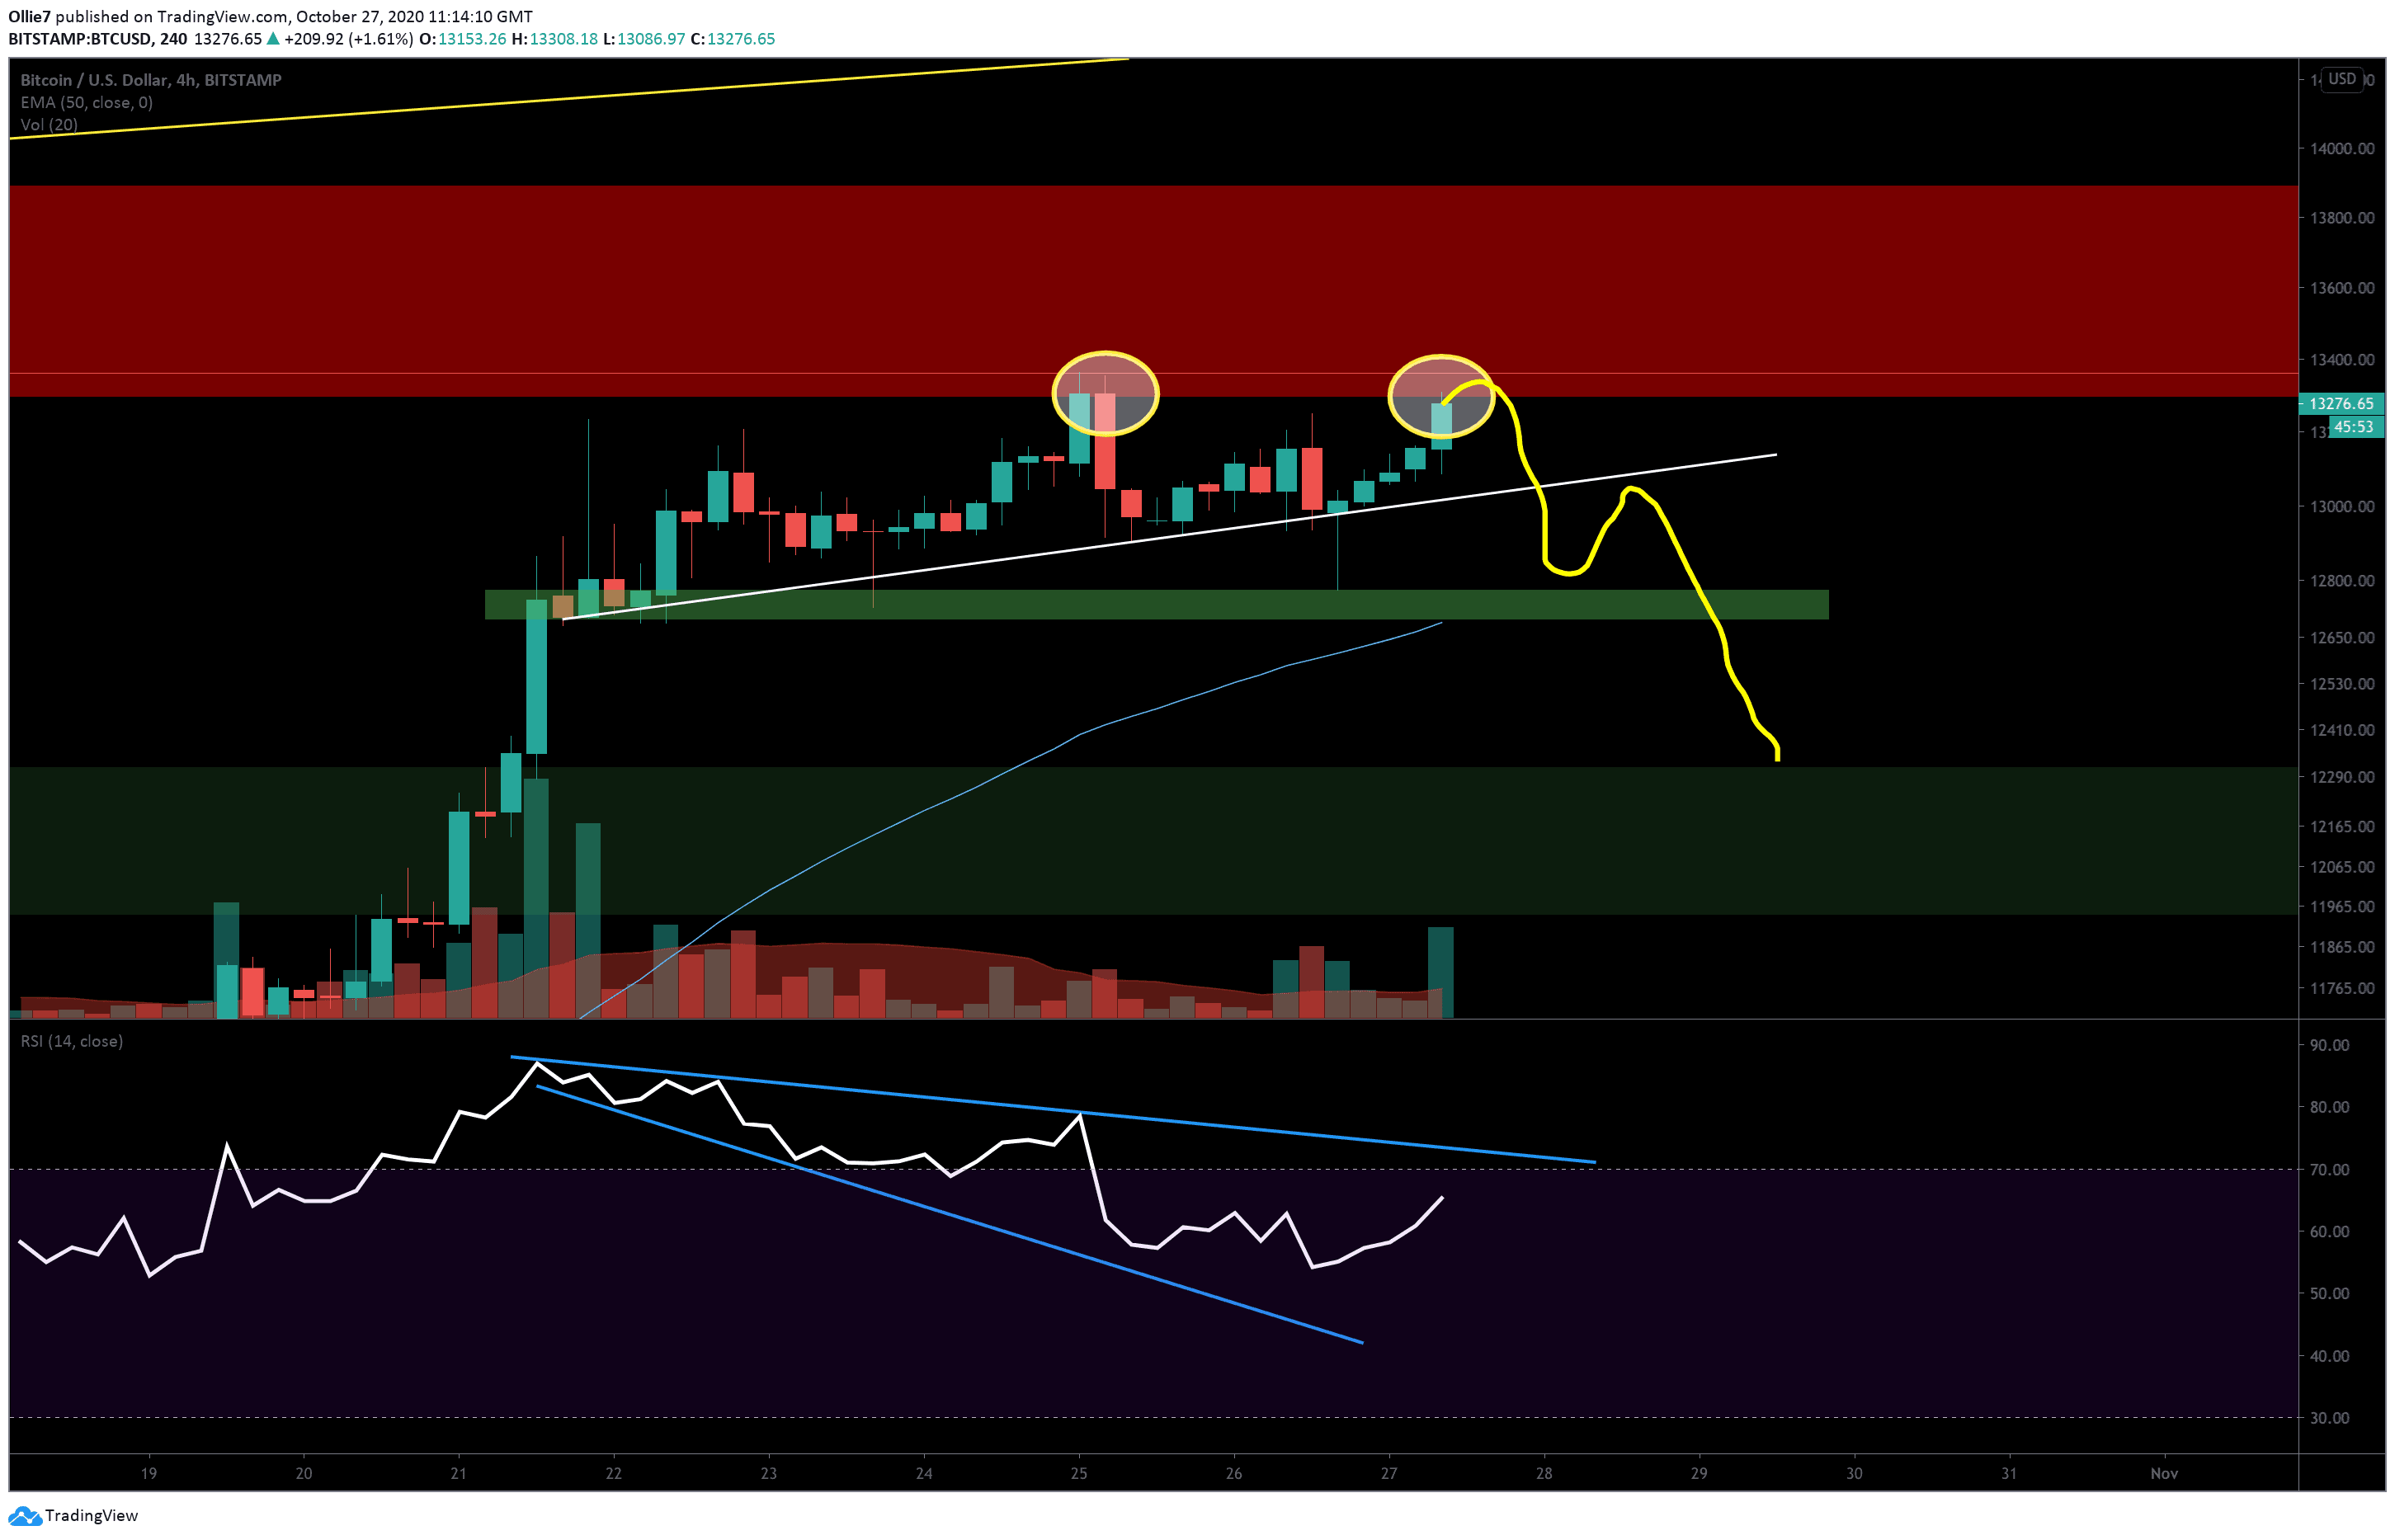
Bitcoin bulls are staging a new breakout attempt right now as prices surge above the 0.618 Fibonacci level around ,360 for the second time in 48 hours. The price wicked to ,500, setting a fresh high for 2020. This is a critically important time for Bitcoin, as a second failure to overcome this level could form a bearish double top and cause prices to plummet. Looking at the global crypto market capital, we can see that volumes are now back to Sunday levels at 7 billion after yesterday’s billion decline. However, we would like to see a higher high preferably above 0 billion to confirm a new bullish phase has started. Price Levels to Watch in the Short-term On the 1-hour BTC/USD chart, we can see that the price action is tracking inside of a bullish flag
Topics:
Ollie Leech considers the following as important: Bitcoin (BTC) Price, BTC Analysis, BTCEUR, BTCGBP, btcusd, btcusdt, social
This could be interesting, too:
Chayanika Deka writes XRP, SOL, and ADA Inclusion in US Crypto Reserve Pushes Traders on Edge
Chayanika Deka writes Why Arthur Hayes Is Bullish on Bitcoin Under Trump’s Economic Strategy
Mandy Williams writes Why the Bitcoin Market Is Stuck—and the Key Metric That Could Change It: CryptoQuant CEO
Wayne Jones writes Metaplanet Acquires 156 BTC, Bringing Total Holdings to 2,391
Bitcoin bulls are staging a new breakout attempt right now as prices surge above the 0.618 Fibonacci level around $13,360 for the second time in 48 hours. The price wicked to $13,500, setting a fresh high for 2020.
This is a critically important time for Bitcoin, as a second failure to overcome this level could form a bearish double top and cause prices to plummet.
Looking at the global crypto market capital, we can see that volumes are now back to Sunday levels at $397 billion after yesterday’s $12 billion decline. However, we would like to see a higher high preferably above $400 billion to confirm a new bullish phase has started.
Price Levels to Watch in the Short-term
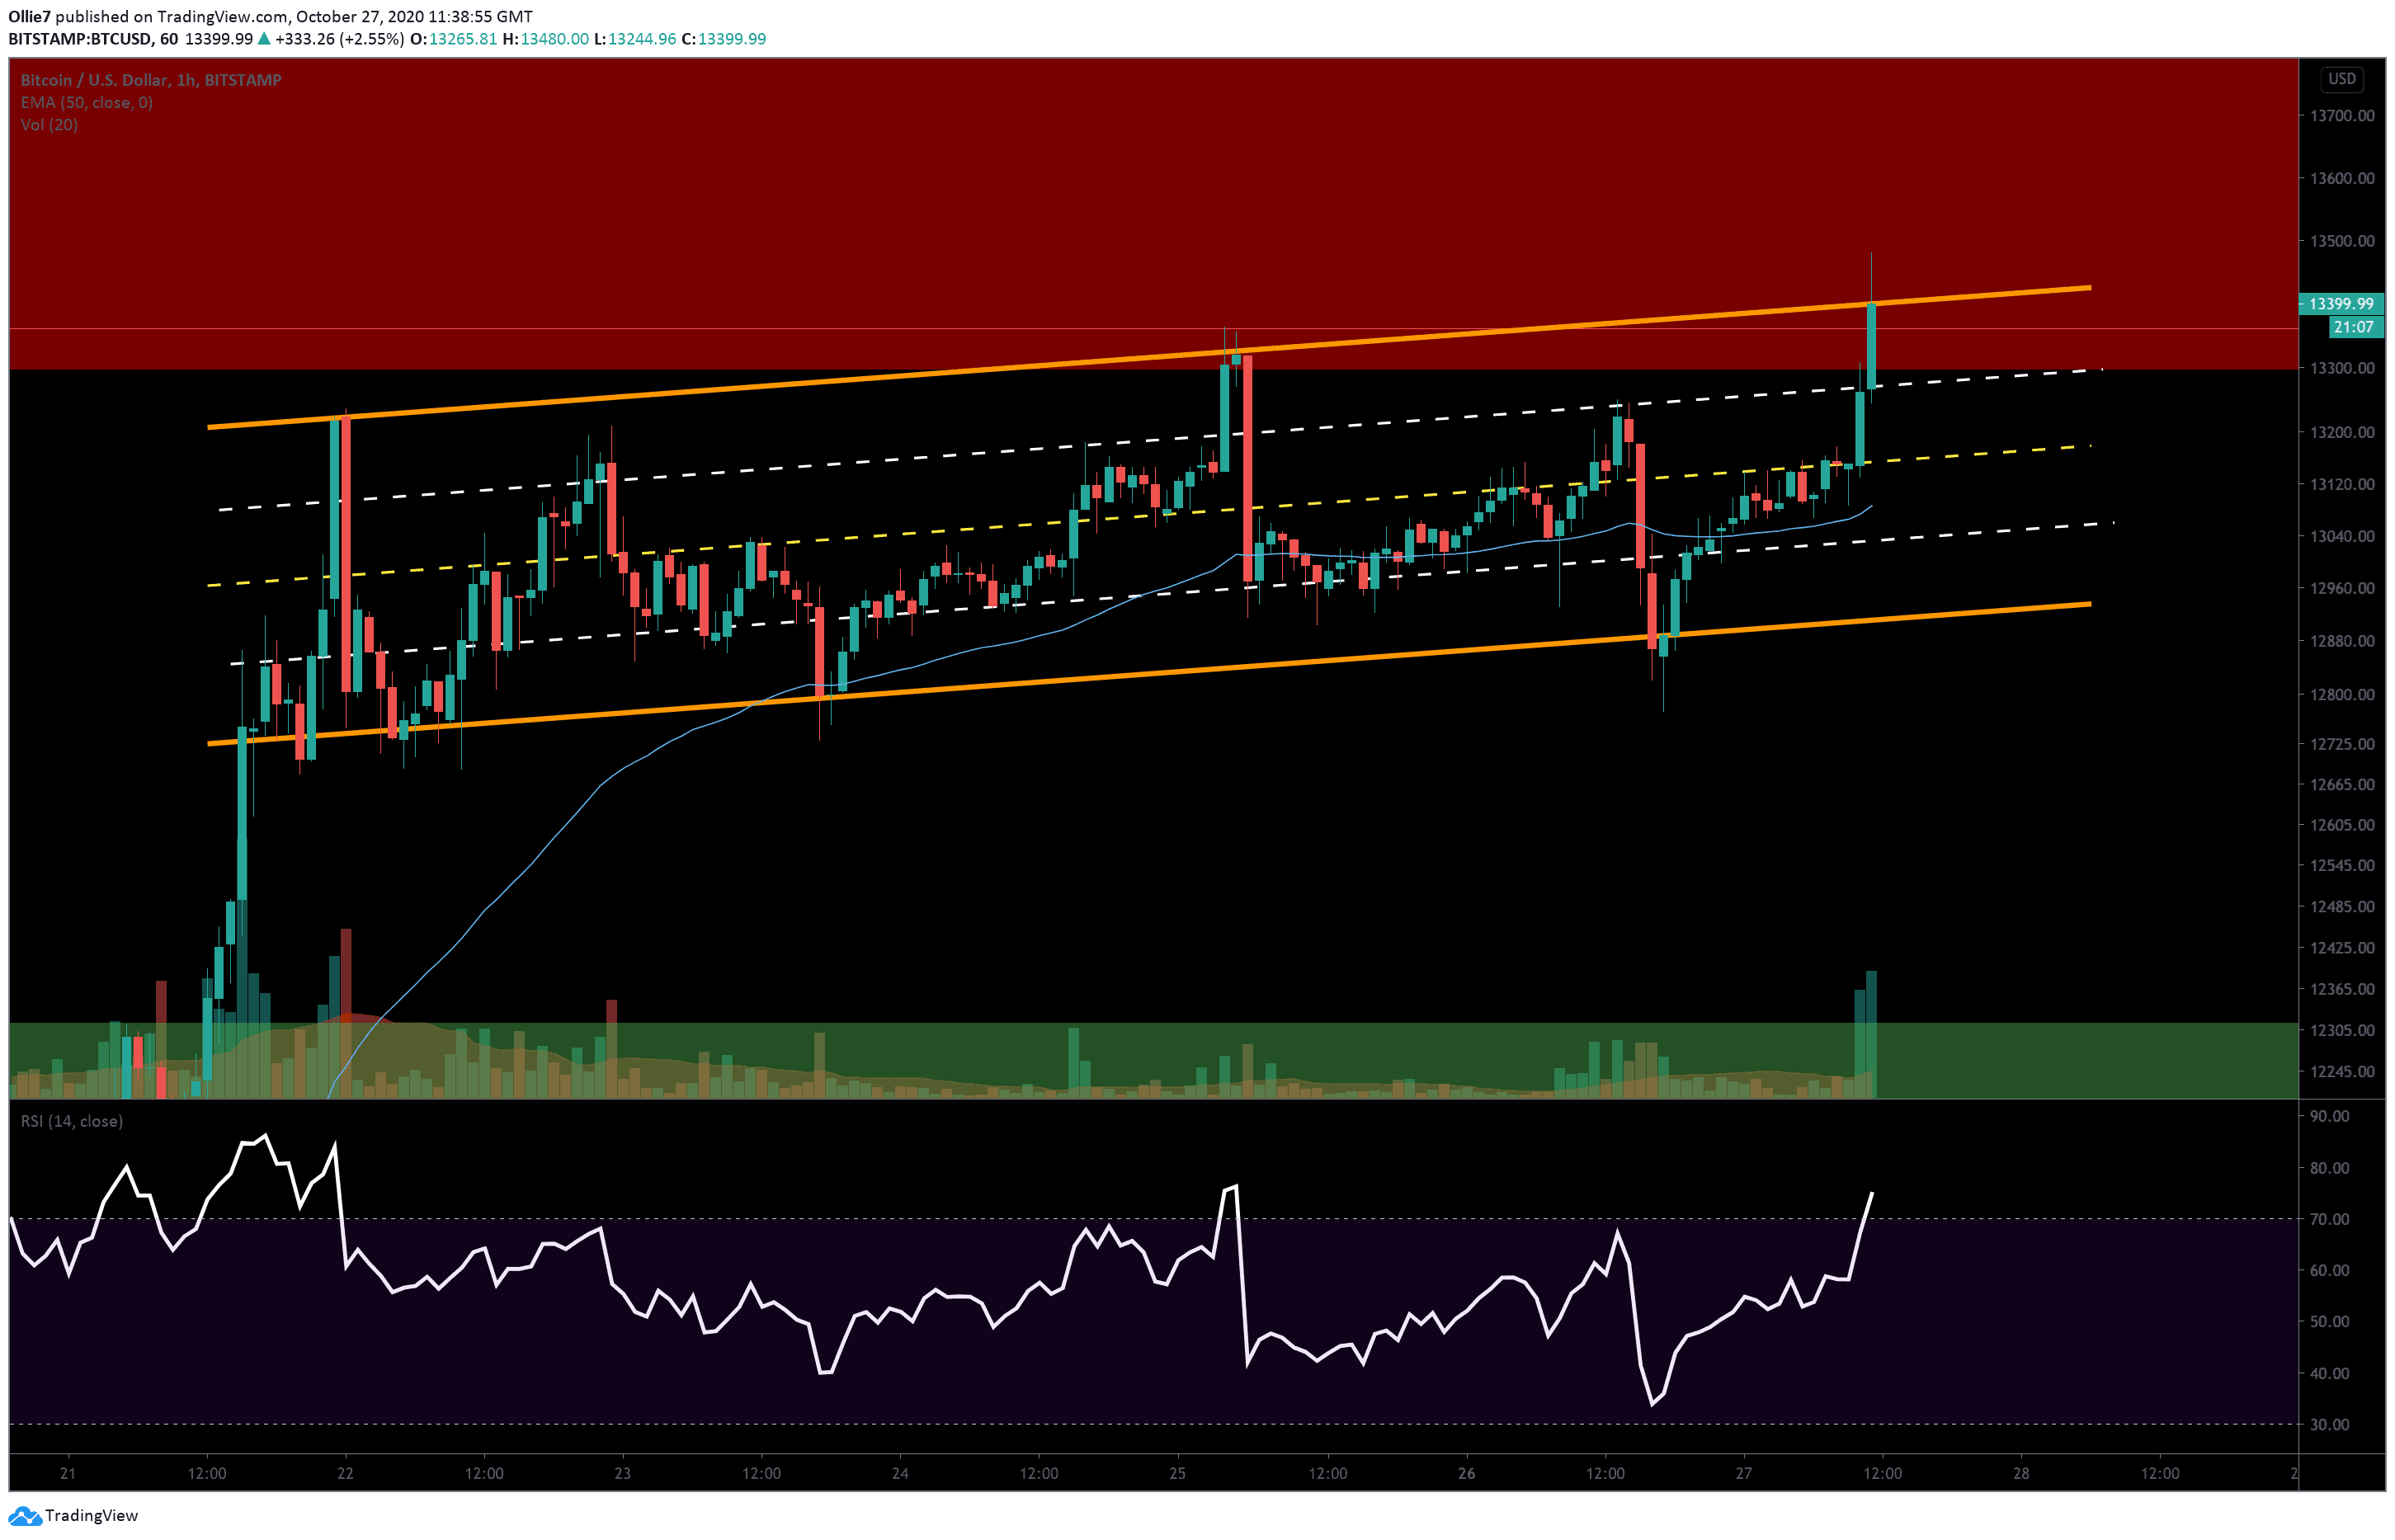
On the 1-hour BTC/USD chart, we can see that the price action is tracking inside of a bullish flag pattern between two up-trending trendlines (orange). We can also see that prices appear to be reacting strongly to median lines (white and yellow dashed lines) inside of these two levels.
Right now, Bitcoin prices have actually broken through the main resistance of this flag pattern. If BTC can remain above this area, then it will be a promising sign that a continuation could occur towards the $13,880 and $14K levels soon.
Bullish traders are, however, running into some strong selling pressure at this area as bears attempt to drive prices back into the flag. The $13,400 mark will be the main area to observe over today’s intraday session – if bears can defend this resistance then it’s likely that we’ll see a breakout to the downside towards the median lines at $13,300, $13,150, $13,000, and $12,915. There is also the 1-hour 50 EMA at $13,080 that could also get a reaction if prices dip that far.
On the 4-hour BTC/USD chart, we can see what might happen if a double top does occur (yellow circles and line). Selling momentum could overcome the up-trending support of the flag pattern and send prices tanking towards the order block support at $12,750 before correcting. From there, it’s possible we could see an attempt to re-enter the flag pattern followed by a throwback off the new resistance and a breakdown to lower levels.
Looking at the RSI over this timeframe, we can see that each time BTC prices have pumped it has printed a lower high on the indicator. This shows that the uptrend is weakening significantly with each new attempt and suggests that bears will likely take over soon unless significant buying volume returns.
Total market capital: $406 billion
Bitcoin market capital: $248 billion
Bitcoin dominance: 61%
*Data by Coingecko.
Bitstamp BTC/USD 1-Hour Chart
Bitstamp BTC/USD 4-Hour Chart