Bitcoin’s price is now sharply correcting after failing to close above the psychological ,000 yesterday.In the last 24hrs, billion has been withdrawn from the market as traders react to the double top that’s now appeared on the 4-hour chart. Bitcoin reached ,100 yesterday and nine days ago, on August 2nd.As of writing these lines, Bitcoin marks ,270 as the current daily low, while yesterday’s high was roughly at ,100. Almost 0 price decline.All eyes will now be on the crucial up-trending support which has already been tested once during the latest candle. BTC will need to remain above this line to keep the bullish ascending triangle pattern in play.Price Levels to Watch Out For in the Short-termThe aforementioned up-trending support (the white line on the following
Topics:
Ollie Leech considers the following as important: Bitcoin (BTC) Price, BTC Analysis, BTCEUR, BTCGBP, btcusd, btcusdt
This could be interesting, too:
Chayanika Deka writes XRP, SOL, and ADA Inclusion in US Crypto Reserve Pushes Traders on Edge
Chayanika Deka writes Why Arthur Hayes Is Bullish on Bitcoin Under Trump’s Economic Strategy
Mandy Williams writes Why the Bitcoin Market Is Stuck—and the Key Metric That Could Change It: CryptoQuant CEO
Wayne Jones writes Metaplanet Acquires 156 BTC, Bringing Total Holdings to 2,391
Bitcoin’s price is now sharply correcting after failing to close above the psychological $12,000 yesterday.
In the last 24hrs, $14 billion has been withdrawn from the market as traders react to the double top that’s now appeared on the 4-hour chart. Bitcoin reached $12,100 yesterday and nine days ago, on August 2nd.
As of writing these lines, Bitcoin marks $11,270 as the current daily low, while yesterday’s high was roughly at $12,100. Almost $900 price decline.
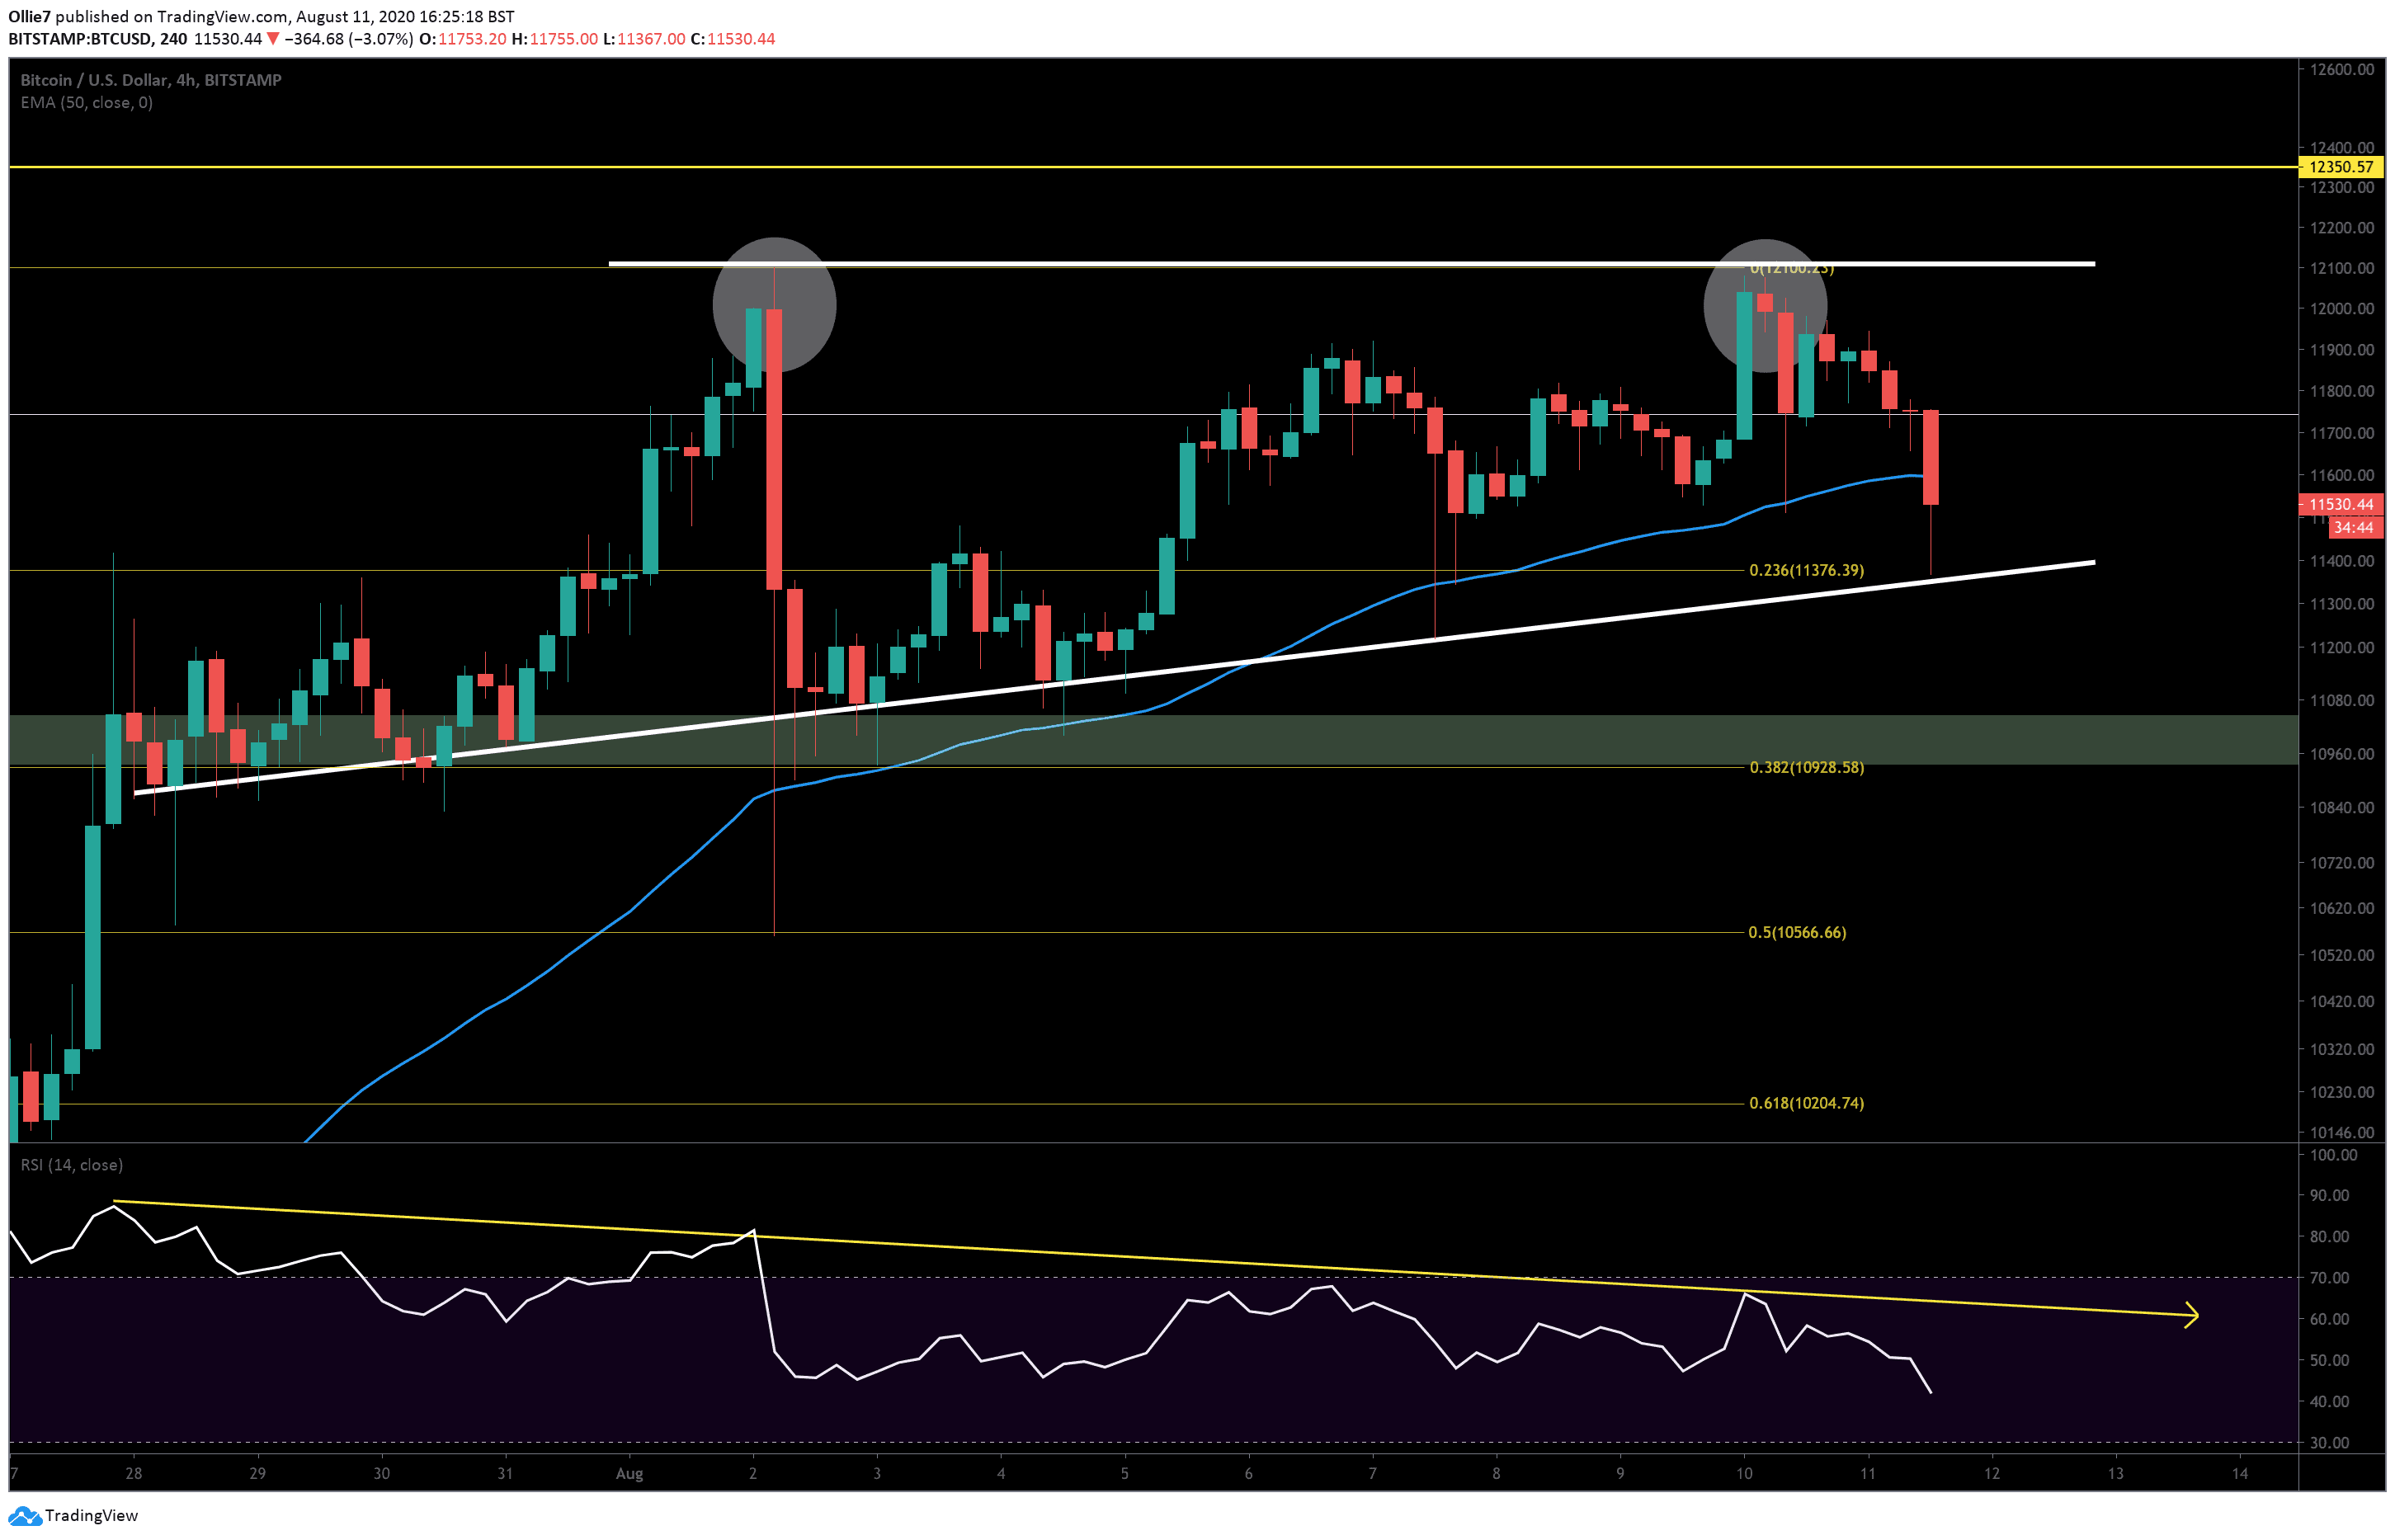
All eyes will now be on the crucial up-trending support which has already been tested once during the latest candle. BTC will need to remain above this line to keep the bullish ascending triangle pattern in play.
Price Levels to Watch Out For in the Short-term
The aforementioned up-trending support (the white line on the following 4-hour chart) is a vital level for bulls to defend during the rest of the intraday trading session. A break beneath this level would likely signal to the market that the trend has turned decidedly bearish.
If that happens, the 100-EMA at $11,200 should provide some support early-on. From there, the $11,060 and $10,920 level could also help to slow the decline.
The $12,000 resistance continues to be the main hurdle for bulls to overcome if they manage to pull off a recovery during this downtrend.
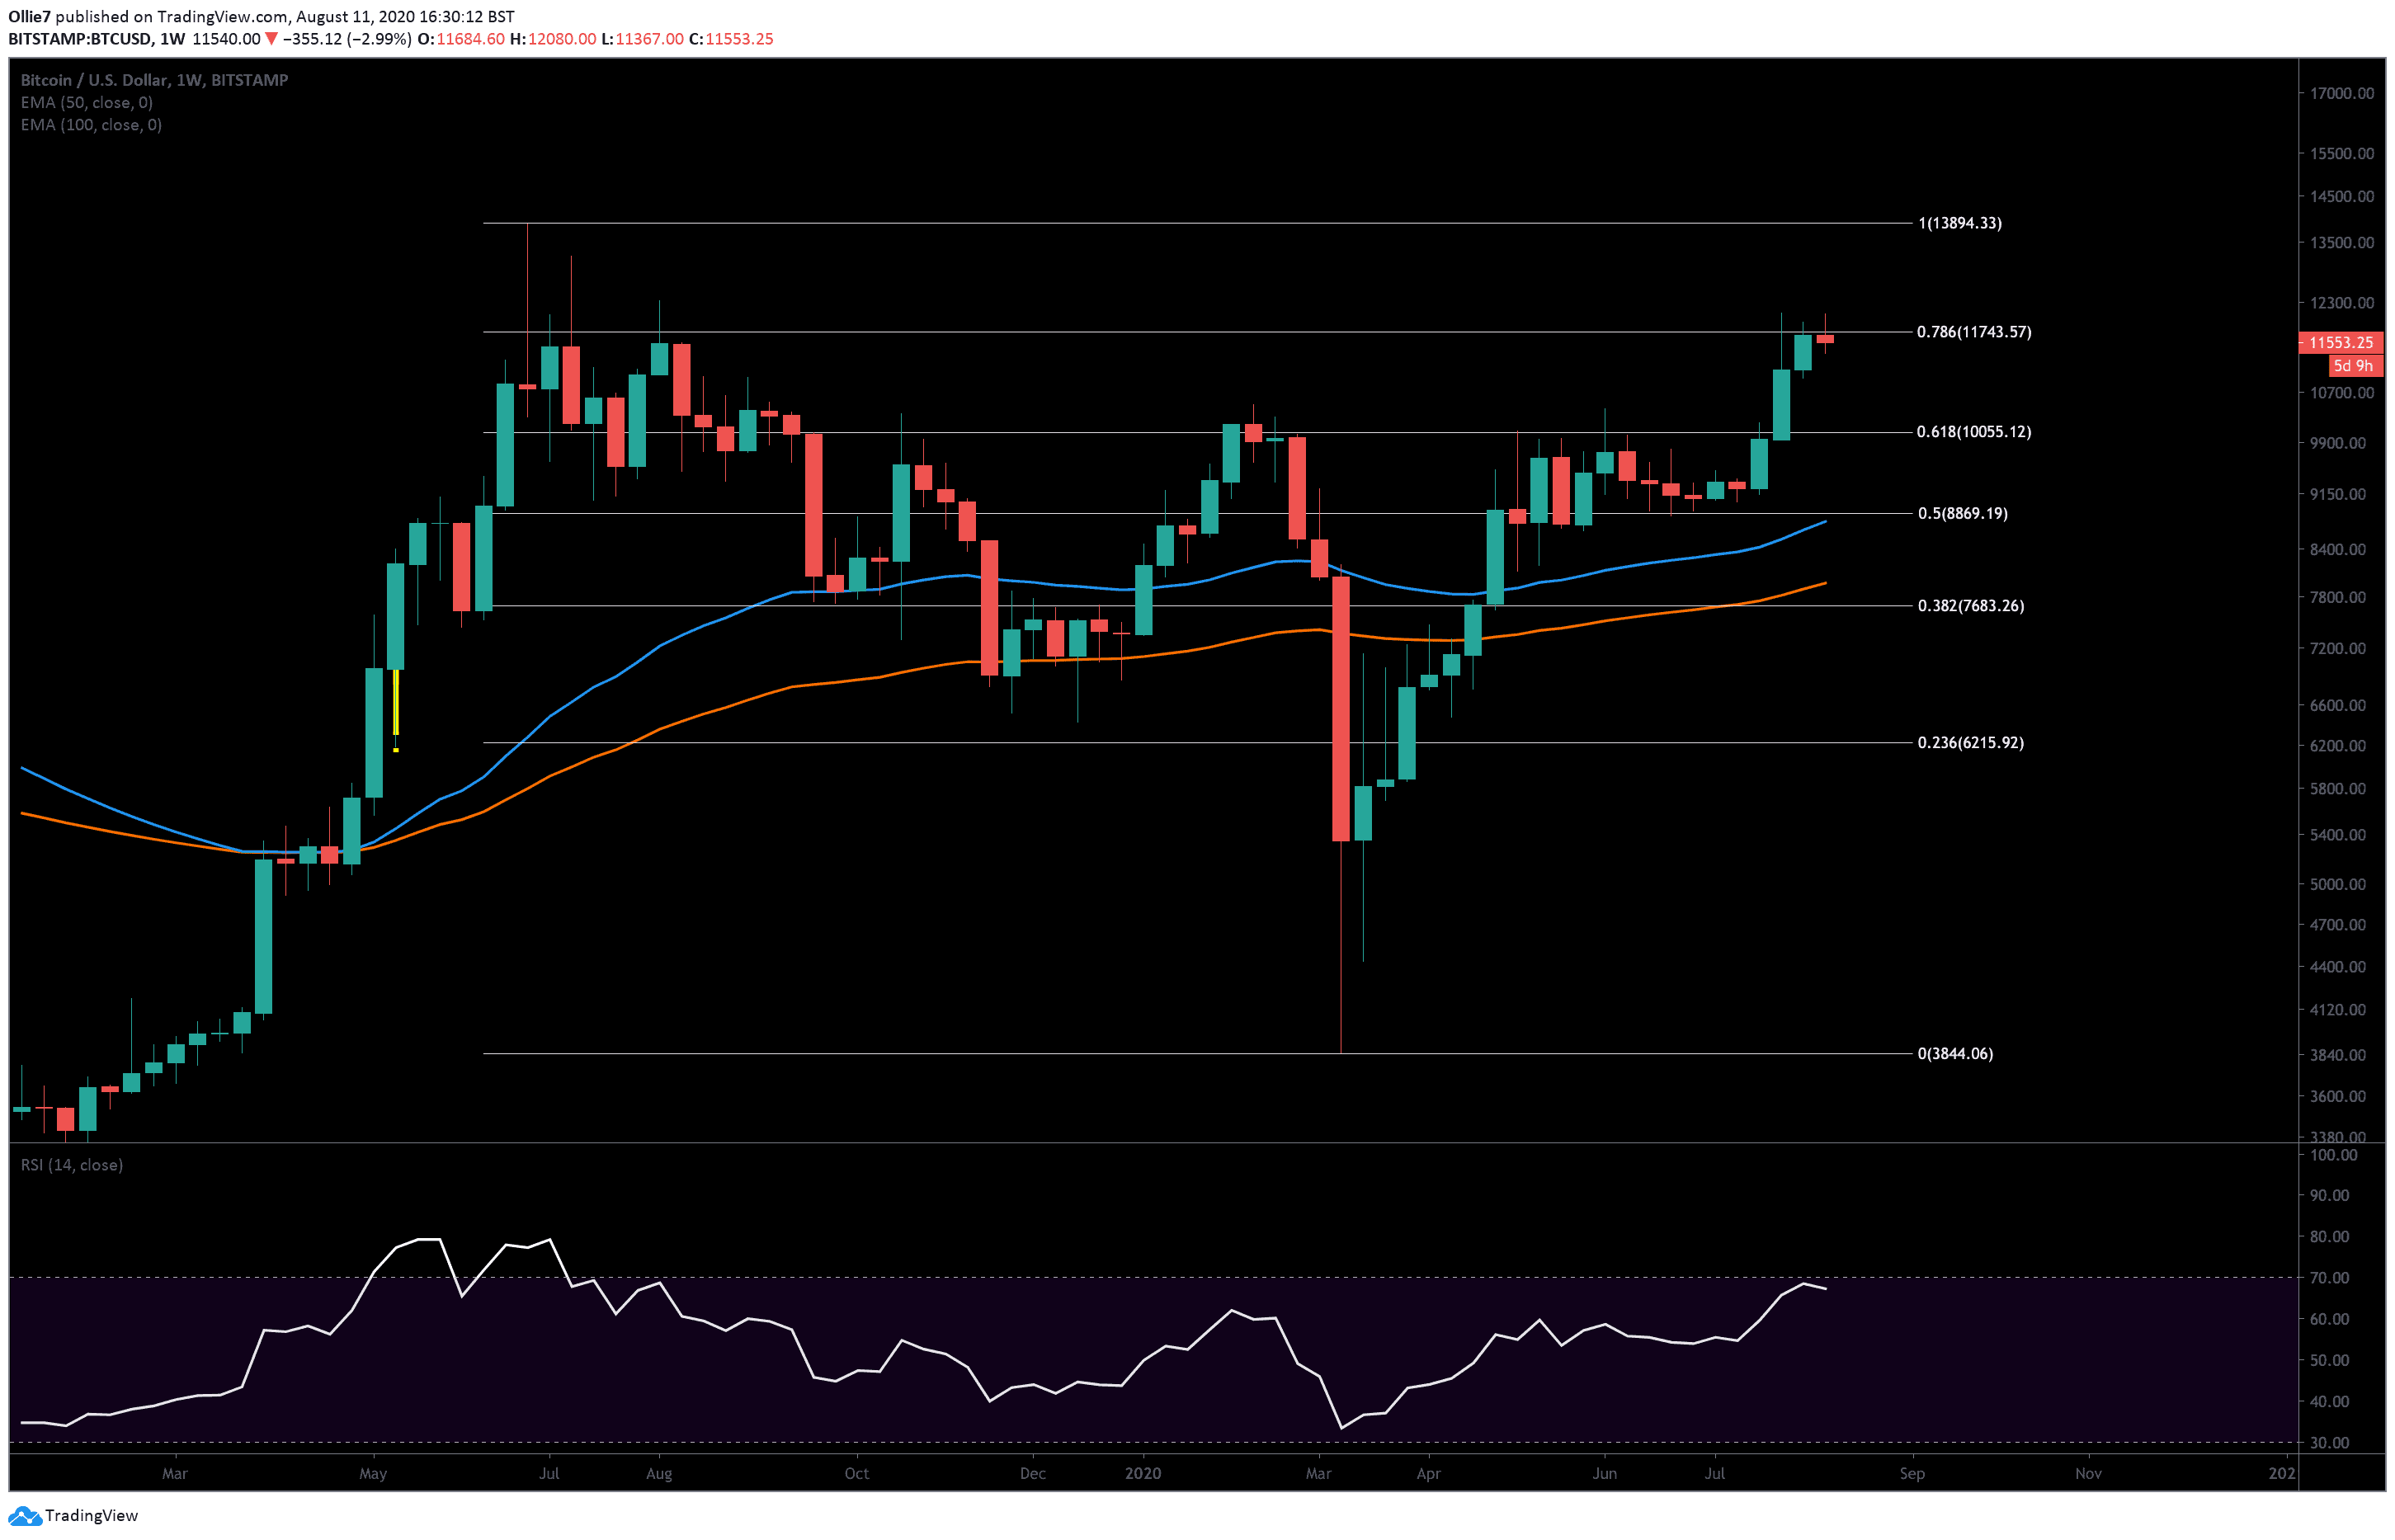
On the macro level, if bitcoin can close above the 0.786 Fibonacci level at $11,743 on the weekly chart, it will be the first time it’s done so since January 2018!
The Technicals: Signs of Reversal?
On the daily BTC/USD chart, there are signs that the trend has reversed. Parabolic SAR dots are now appearing above the price action for the first time since July 21.
There’s also a bearish convergence between the 12 and 26 moving averages on the MACD indicator, and bearish volume now appearing on the histogram.
Adding to the bearish signals, there’s even a sizeable divergence between the price action and the 4-hour RSI.
BTC/USD Bitstamp 4-Hour Chart
BTC/USD Bitstamp Weekly Chart