Bitcoin price continues its parabolic intraweek rally with a surging breakout from the bullish pennant we discussed in yesterday’s analysis. Since the opening of the traditional markets on Monday, BTC has risen by an eye-watering 17%.With the leading crypto asset now holding at around ,700, it’s only 5% shy from getting back to its all-time high set on December 17, 2017 – 1,069 days ago.Looking at the global crypto picture, a further billion has entered the market in the last 16 hours.Price Levels to Watch in the Short-termOn the 1-hour BTC/USD chart, we can see that the ,800 level has created some intraday resistance as bullish traders eye the psychological K level above. This is the first wall bullish traders need to push through if the uptrend is to continue and is being
Topics:
Ollie Leech considers the following as important: Bitcoin (BTC) Price, BTC Analysis, BTCEUR, BTCGBP, btcusd, btcusdt
This could be interesting, too:
Chayanika Deka writes XRP, SOL, and ADA Inclusion in US Crypto Reserve Pushes Traders on Edge
Chayanika Deka writes Why Arthur Hayes Is Bullish on Bitcoin Under Trump’s Economic Strategy
Mandy Williams writes Why the Bitcoin Market Is Stuck—and the Key Metric That Could Change It: CryptoQuant CEO
Wayne Jones writes Metaplanet Acquires 156 BTC, Bringing Total Holdings to 2,391
Bitcoin price continues its parabolic intraweek rally with a surging breakout from the bullish pennant we discussed in yesterday’s analysis. Since the opening of the traditional markets on Monday, BTC has risen by an eye-watering 17%.
With the leading crypto asset now holding at around $18,700, it’s only 5% shy from getting back to its all-time high set on December 17, 2017 – 1,069 days ago.
Looking at the global crypto picture, a further $21 billion has entered the market in the last 16 hours.
Price Levels to Watch in the Short-term
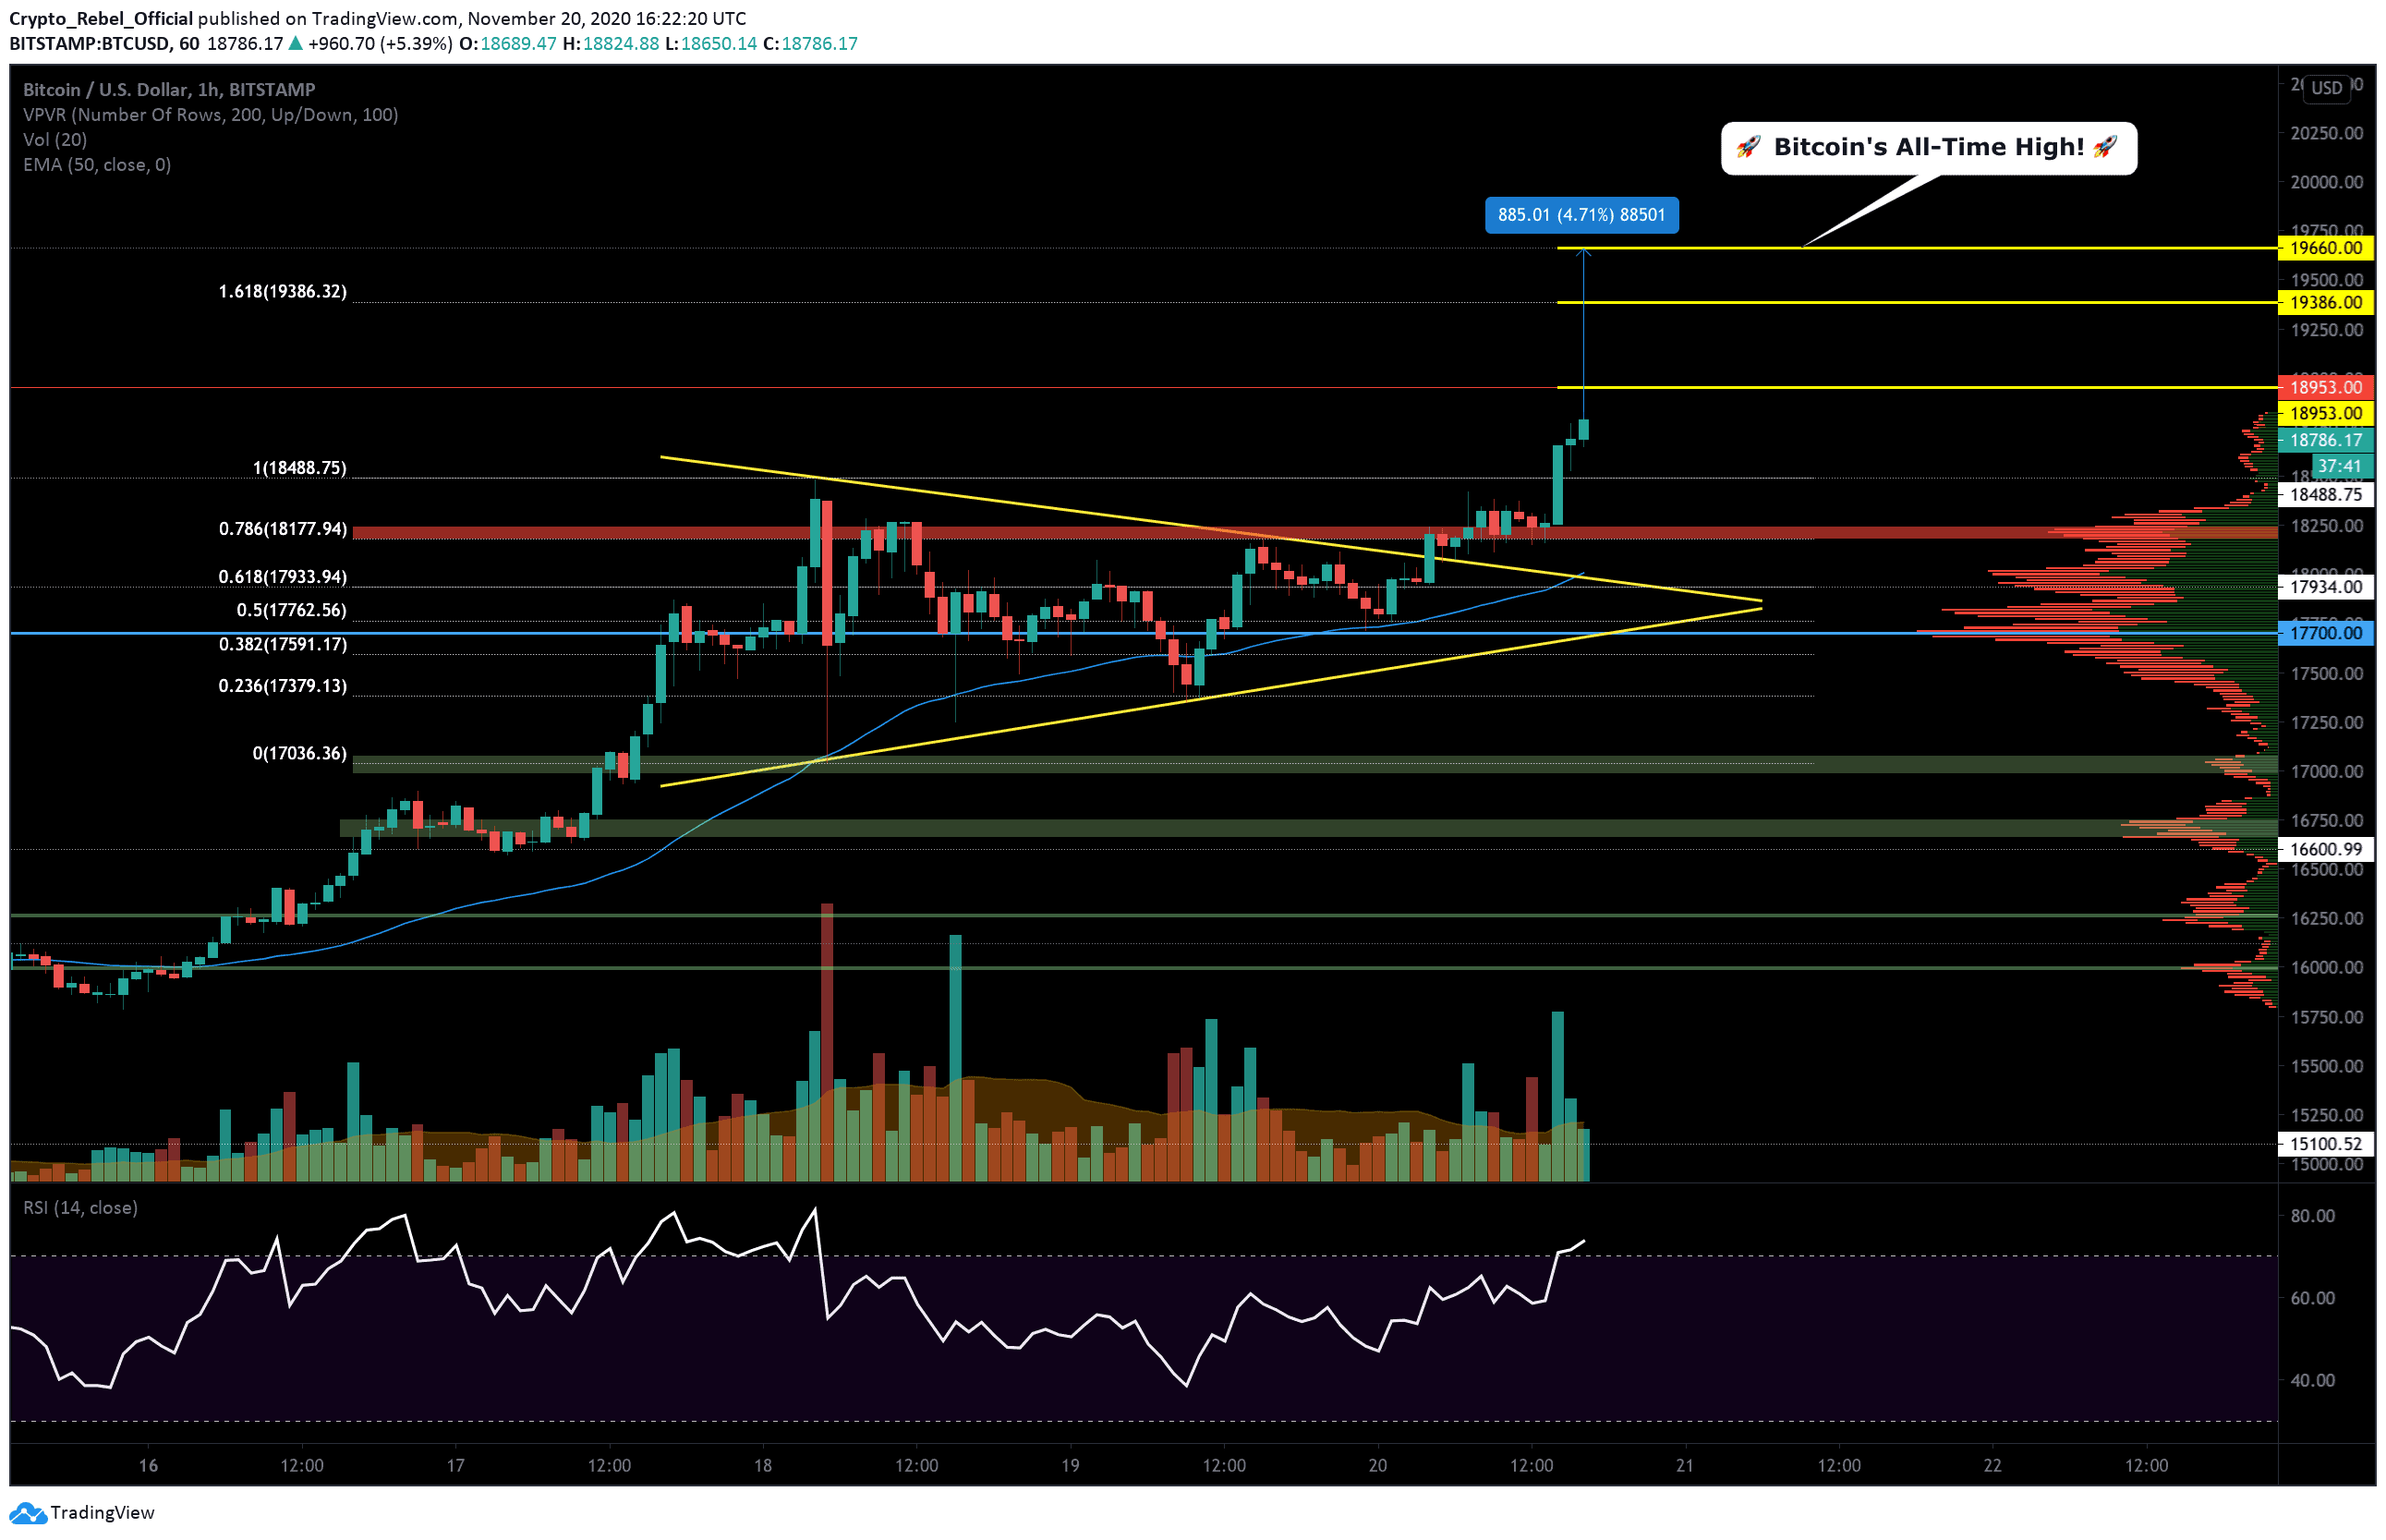
On the 1-hour BTC/USD chart, we can see that the $18,800 level has created some intraday resistance as bullish traders eye the psychological $19K level above. This is the first wall bullish traders need to push through if the uptrend is to continue and is being made all the more difficult by the fact BTC has broken into the overbought region on the RSI.
If this is overcome, there is a much stronger resistance at $18,953 (lowest yellow line) that represents the highest weekly close ever on Bitcoin’s chart. This will be a major test of bullish confidence.
Above that, we have the 1.618 Fibonacci resistance at $19,386 and the all-time high at $19,660. From there folks, we are into price discovery!
If the trend reverses and bears manage to make a dent in the current bullish momentum, then we should expect to see $18,488, the main support zone (red bar) around $18,200, and the 50-EMA line (blue) approximately at $18K provide some support against further decline.
If those fail, we should see a strong reaction around the Point of Control (thick blue line) at $17,700 and the $17,000 level below that.
Total market capital: $531 billion
Bitcoin market capital: $347 billion
Bitcoin dominance: 65.2%
*Data provided by Coingecko.
Bitstamp BTC/USD 1-Hour Chart