Bitcoin bears have successfully taken back control of the asset this week and are now trying to secure a daily close beneath the K for the first time since this month. The global crypto market capital has been steadily declining over the last seven days and is now back below 0 billion.Right now, the leading crypto is tiptoeing on the edge of the ,300 CME gap which sits just below the current price and extends all the way down to ,995. In order to fill this gap, bitcoin’s price will have to fall a further 6.95% which will almost certainly drag the rest of the alt market down with it.Price Levels to Watch in the Short-termOn the daily BTC/USD chart, we can see that the crypto-asset now appears to be tracking inside a large down-trending channel (light blue) after breaking
Topics:
Ollie Leech considers the following as important: Bitcoin (BTC) Price, BTC Analysis, BTCEUR, BTCGBP, btcusd, btcusdt
This could be interesting, too:
Chayanika Deka writes XRP, SOL, and ADA Inclusion in US Crypto Reserve Pushes Traders on Edge
Chayanika Deka writes Why Arthur Hayes Is Bullish on Bitcoin Under Trump’s Economic Strategy
Mandy Williams writes Why the Bitcoin Market Is Stuck—and the Key Metric That Could Change It: CryptoQuant CEO
Wayne Jones writes Metaplanet Acquires 156 BTC, Bringing Total Holdings to 2,391
Bitcoin bears have successfully taken back control of the asset this week and are now trying to secure a daily close beneath the $18K for the first time since this month. The global crypto market capital has been steadily declining over the last seven days and is now back below $540 billion.
Right now, the leading crypto is tiptoeing on the edge of the $1,300 CME gap which sits just $25 below the current price and extends all the way down to $16,995. In order to fill this gap, bitcoin’s price will have to fall a further 6.95% which will almost certainly drag the rest of the alt market down with it.
Price Levels to Watch in the Short-term
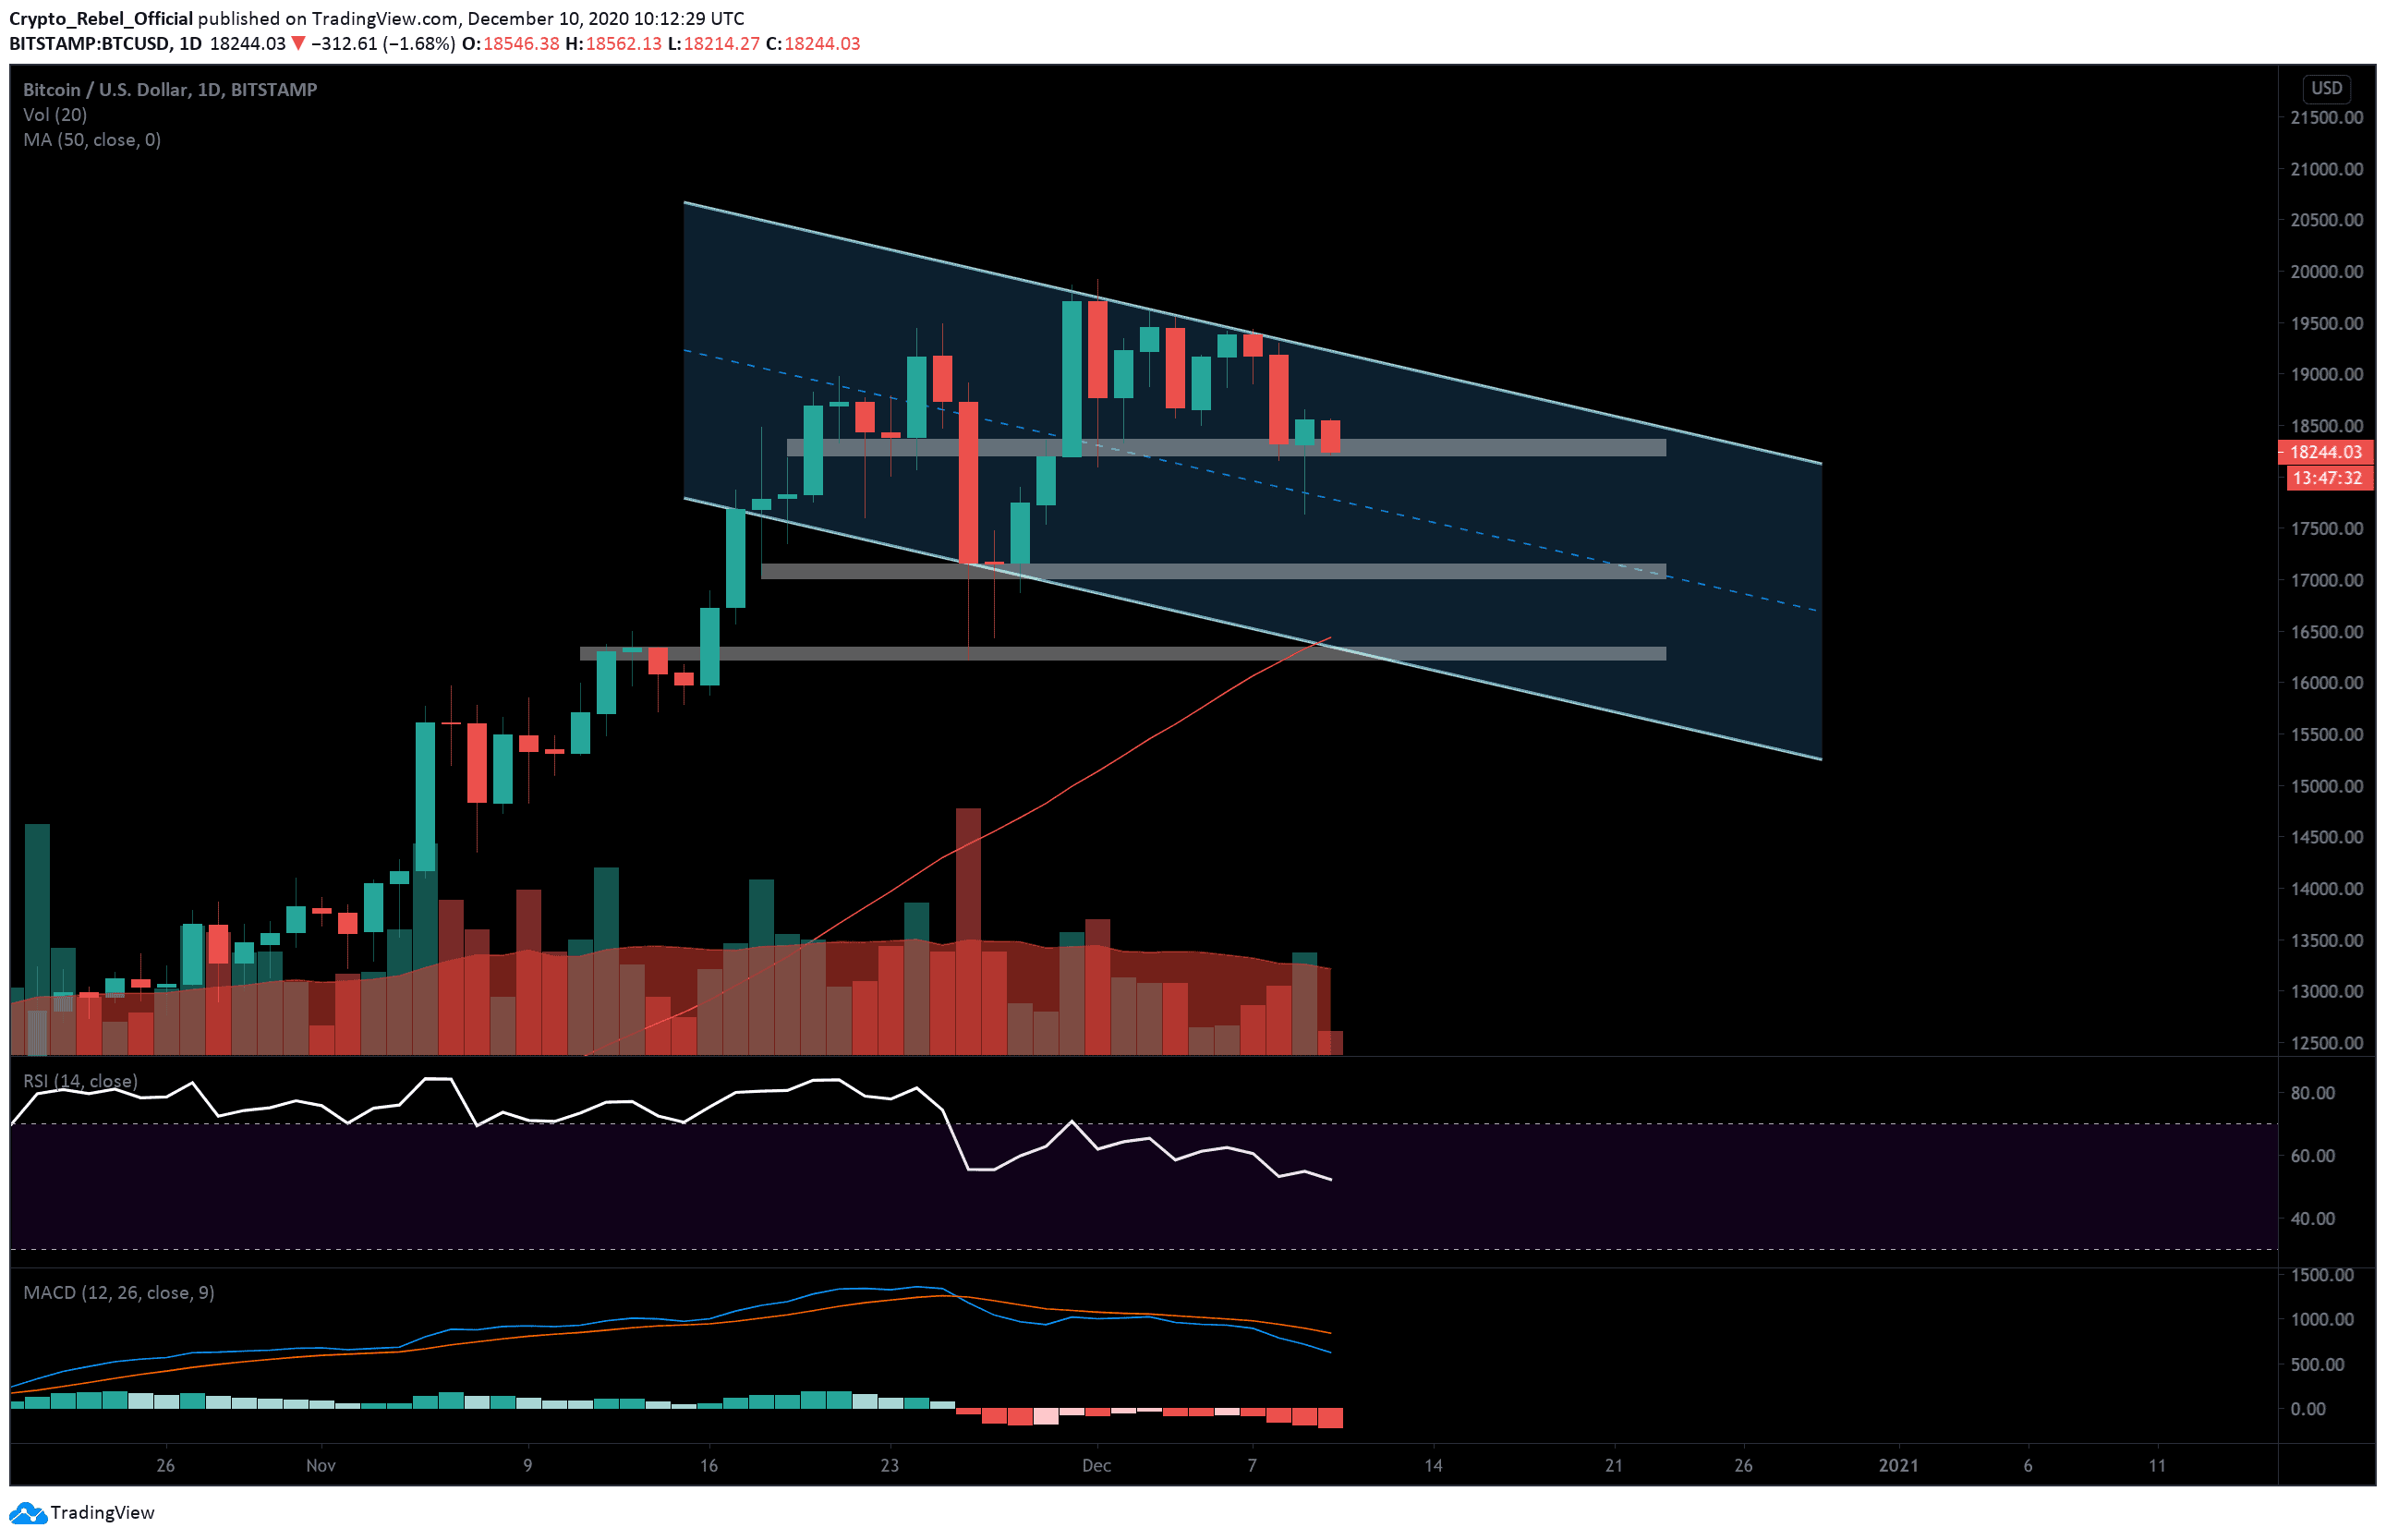
On the daily BTC/USD chart, we can see that the crypto-asset now appears to be tracking inside a large down-trending channel (light blue) after breaking bearish from the pennant pattern that we looked at in a previous analysis.
There are three main support zones inside this channel that should help to prop prices up during the decline.
(1) $18,380-$18,180
(2) $17,180 – $17,000
(3) $16,340 – $16,200
The daily 50-EMA (red) and the main channel support will also likely see strong reactions if prices break down that far.
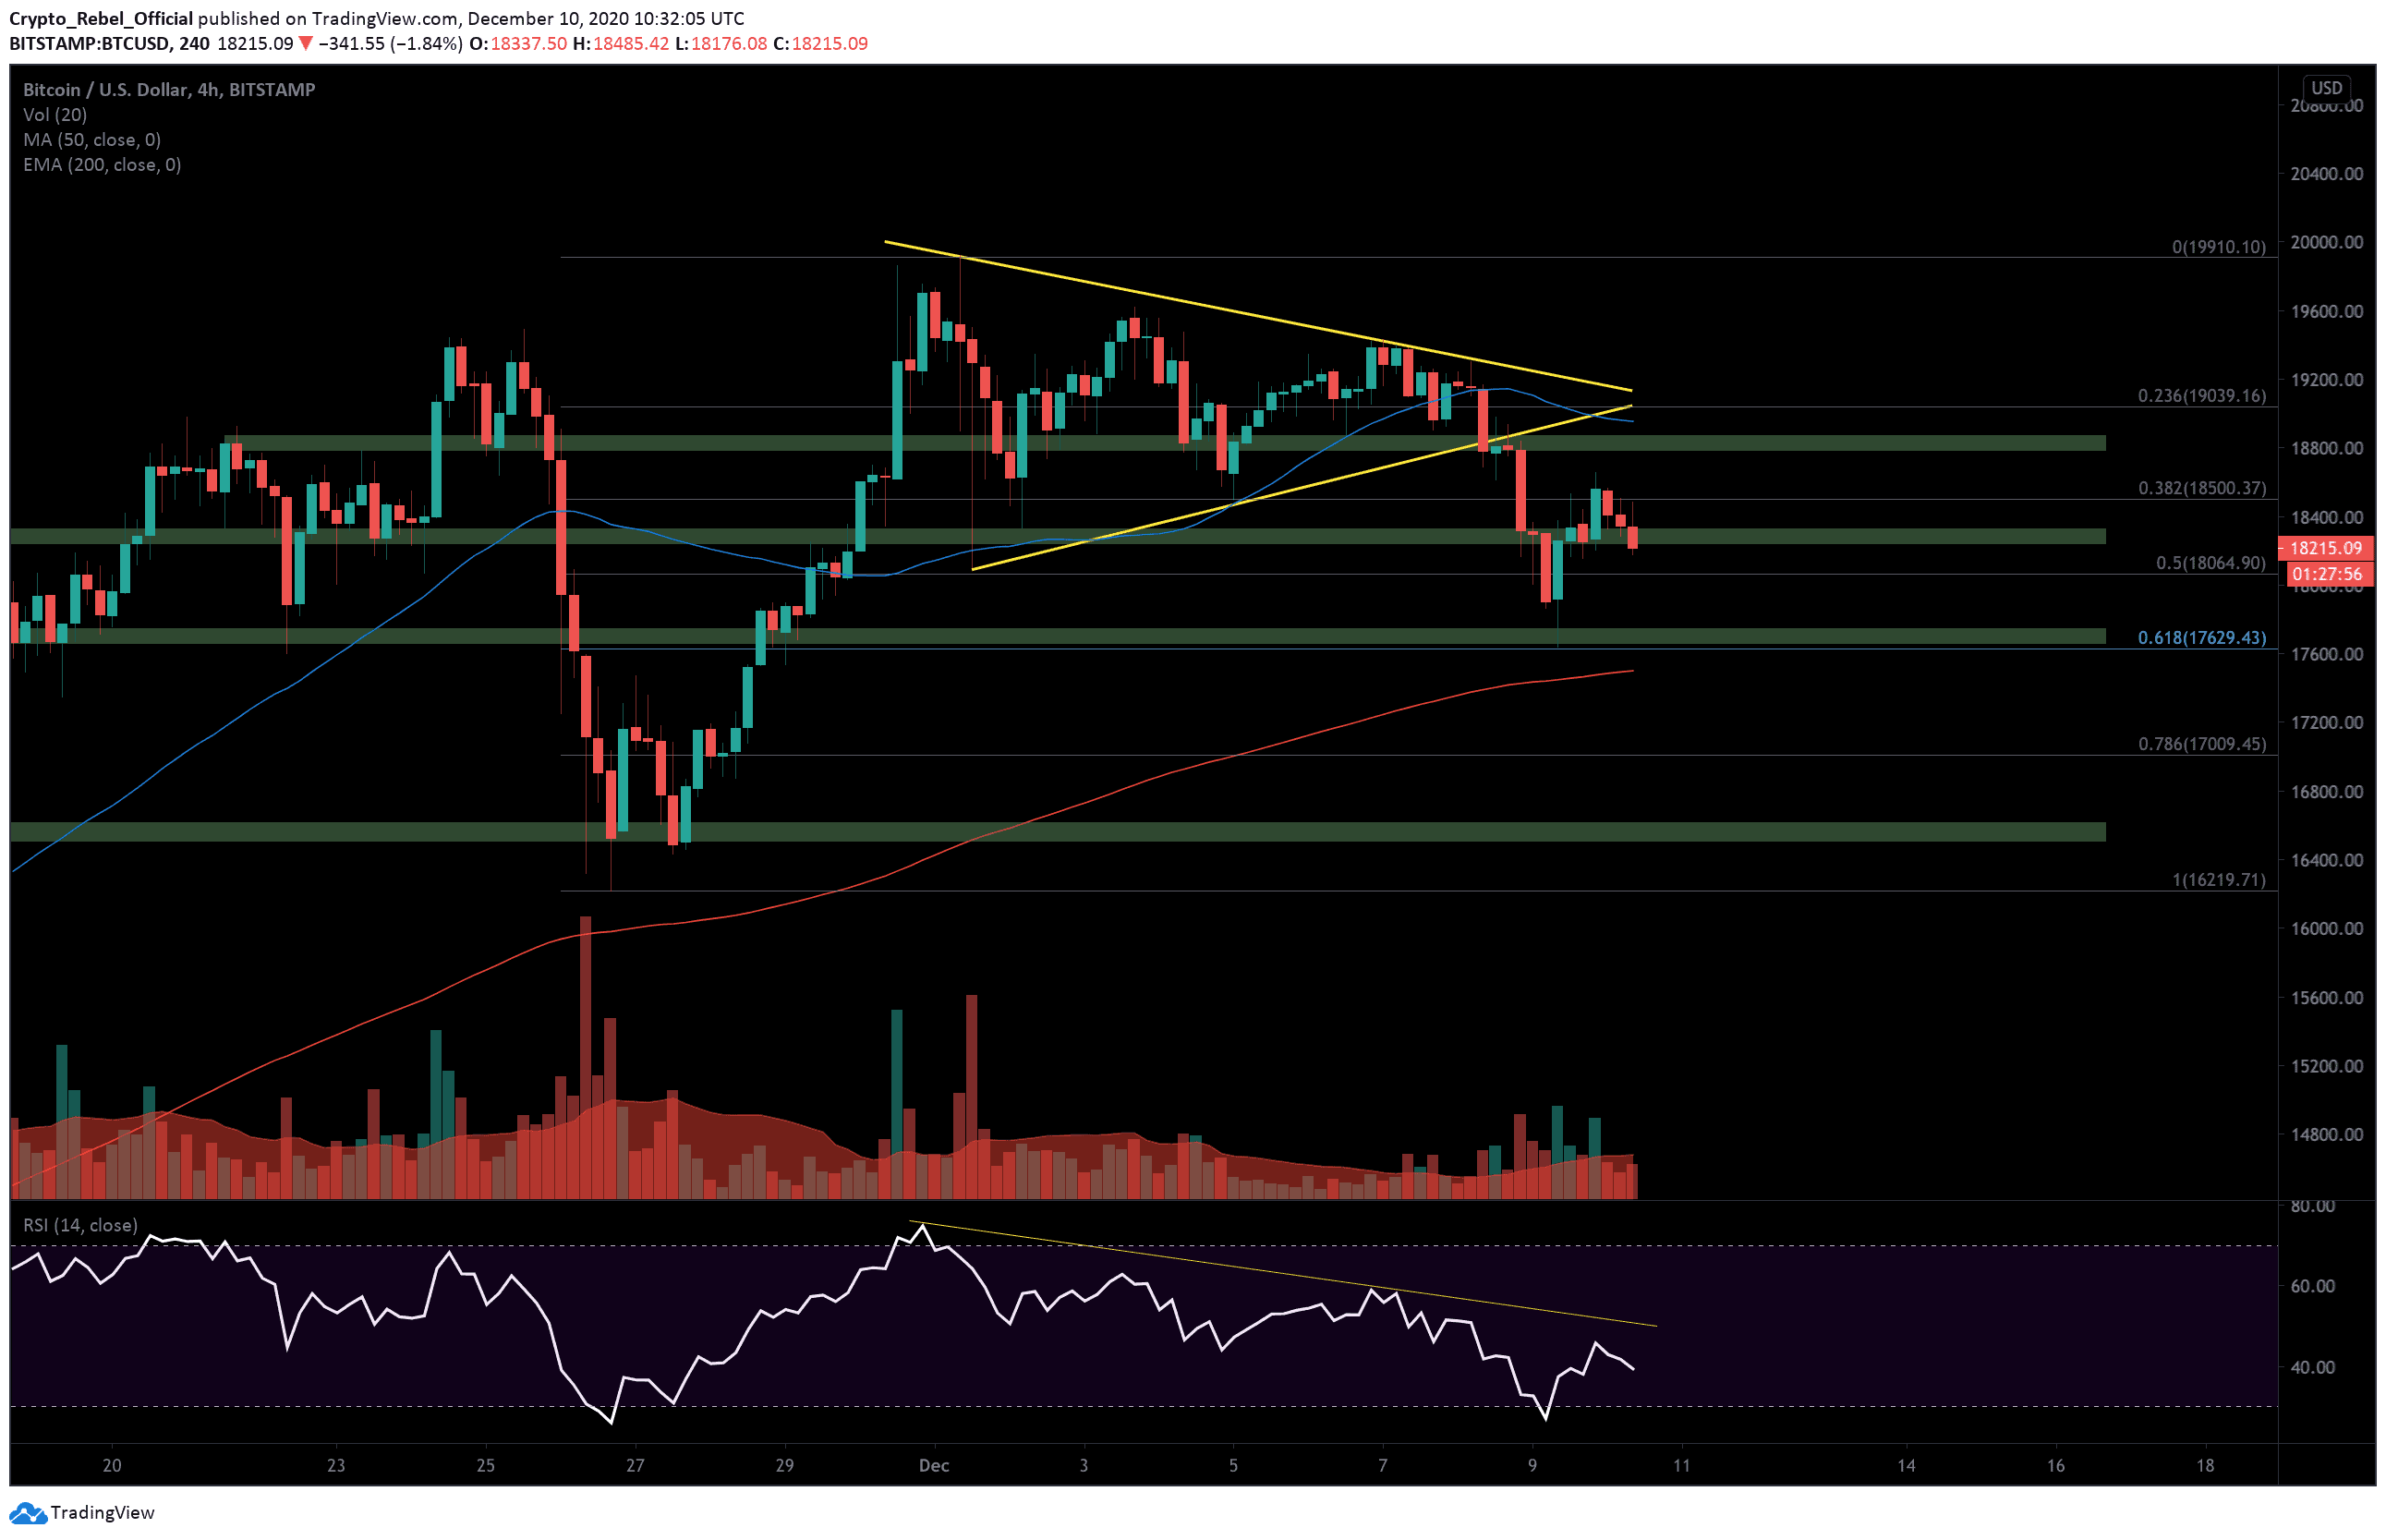
Looking at the 4-hour BTC/USD, we get a clearer idea of the resistances above if bullish traders manage to stage a comeback in the short-term. While all indicators point to a bearish continuation, we may see a temporary push back as buyers fight to keep BTC above the CME gap.
The main short-term resistances to observe going into the weekend are as follows:
(1) $18,500 – 0.382 Fibonacci level.
(2) $18,800 – Key S/R level.
(3) $19,385 – Key 4-hour resistance.
It’s worth noting that right now the 4-hour RSI is stuck beneath a clear down-trending resistance, but if we see the indicator line break the current sloping resistance (yellow line) it could be construed as an early sign that bullish momentum is beginning to return.
Total market capital: $545 billion
Bitcoin market capital: $337 billion
Bitcoin dominance: 61.8%
*Data by Coingecko.
Bitstamp BTC/USD Daily Chart
Bitstamp BTC/USD 4-Hour Chart