Bitcoin price is tracking inside a pennant pattern right now as candle wicks pinch between two trend lines (yellow). This is a classic bullish continuation pattern and usually results in a strong breakout once the asset reaches maximum consolidation.According to new figures from Skew, the statistical likelihood of Bitcoin’s price ending the year higher than ,000 – it’s current all-time high – now stands above 25%.Despite this optimism, however, short-term volatility has slackened right off during this period of consolidation. The global crypto market capital has been holding steady around 0 billion for the last 3 days. Will we see another surging rally start soon?Price Levels to Watch in the Short-term.On the 1-hour BTC/USD chart, we can see that the leading cryptocurrency is
Topics:
Ollie Leech considers the following as important: Bitcoin (BTC) Price, BTC Analysis, BTCEUR, BTCGBP, btcusd, btcusdt
This could be interesting, too:
Chayanika Deka writes XRP, SOL, and ADA Inclusion in US Crypto Reserve Pushes Traders on Edge
Chayanika Deka writes Why Arthur Hayes Is Bullish on Bitcoin Under Trump’s Economic Strategy
Mandy Williams writes Why the Bitcoin Market Is Stuck—and the Key Metric That Could Change It: CryptoQuant CEO
Wayne Jones writes Metaplanet Acquires 156 BTC, Bringing Total Holdings to 2,391
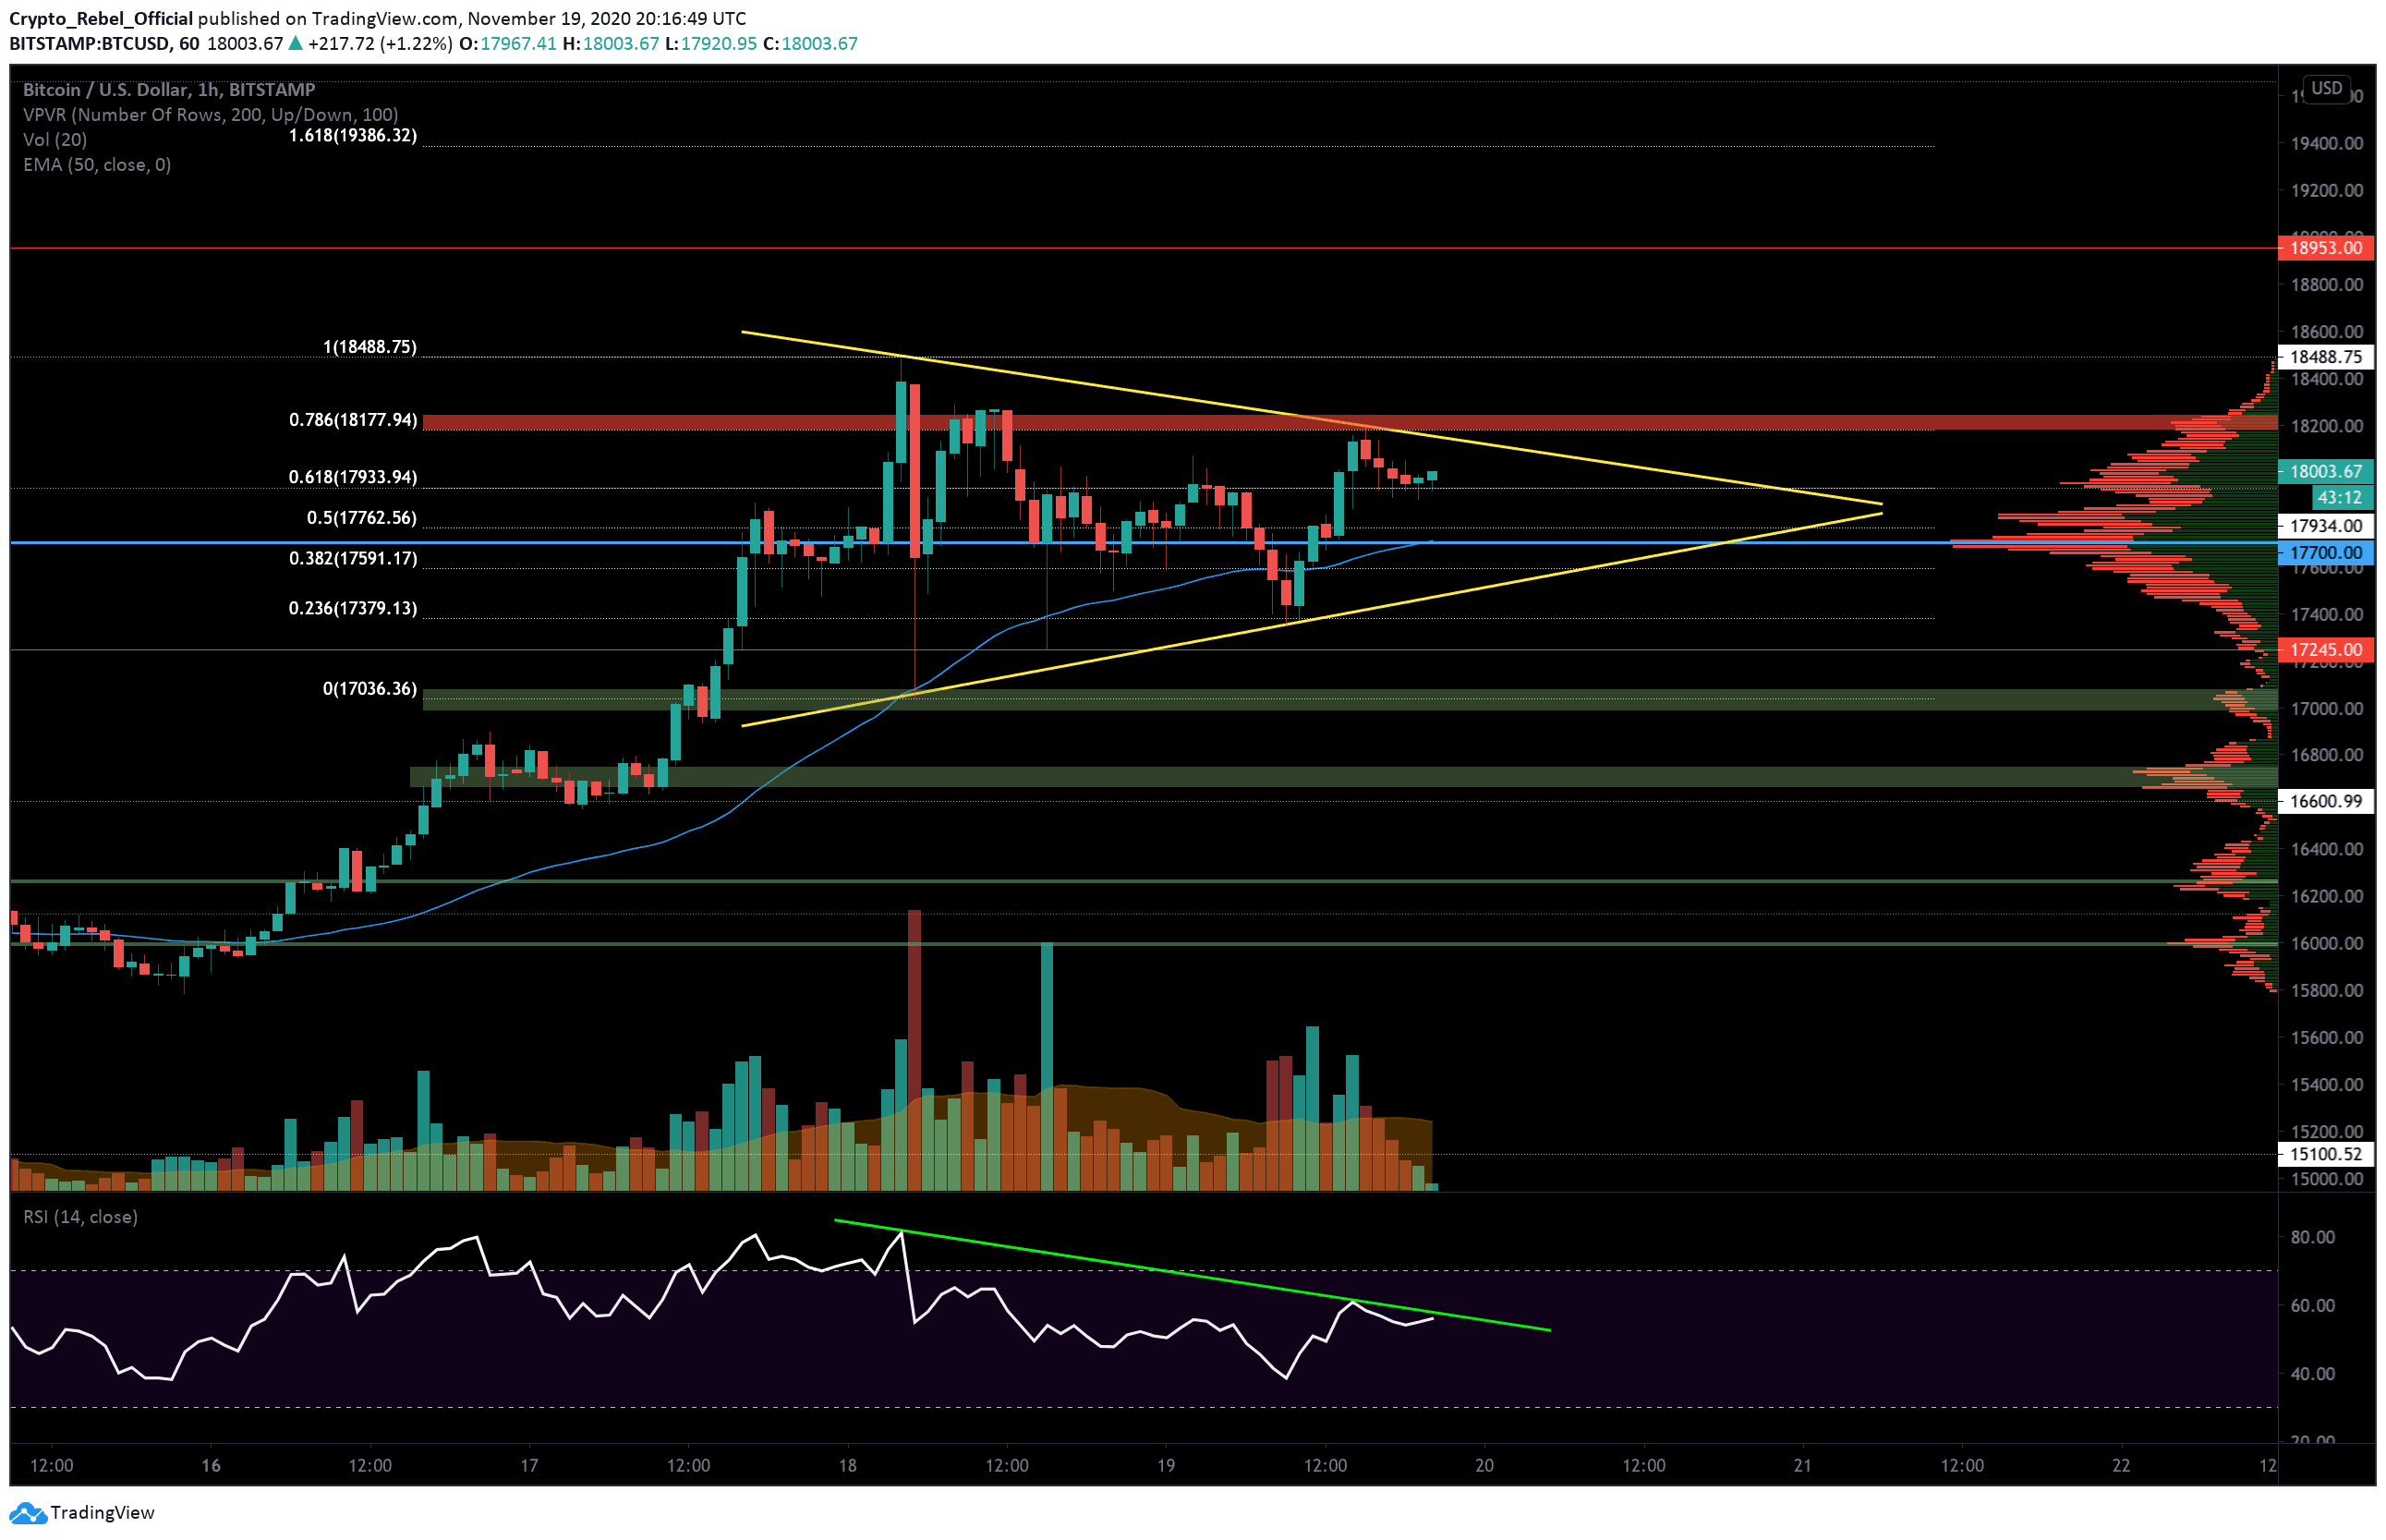
Bitcoin price is tracking inside a pennant pattern right now as candle wicks pinch between two trend lines (yellow). This is a classic bullish continuation pattern and usually results in a strong breakout once the asset reaches maximum consolidation.
According to new figures from Skew, the statistical likelihood of Bitcoin’s price ending the year higher than $20,000 – it’s current all-time high – now stands above 25%.
Despite this optimism, however, short-term volatility has slackened right off during this period of consolidation. The global crypto market capital has been holding steady around $500 billion for the last 3 days. Will we see another surging rally start soon?
Price Levels to Watch in the Short-term.
On the 1-hour BTC/USD chart, we can see that the leading cryptocurrency is currently resting along with the key 0.618 Fibonacci support at $17,933 after an unsuccessful attempt to break the first major short-term resistance at $18,200 (red bar).
If bullish traders can overcome this area, then we should expect to see the next set of resistances at the following levels above:
(1) $18,488 – the current high (1.0 Fibonacci level on the chart).
(2) $18,953 – key daily resistance from December 2017 (red line).
(3) $19,386 – 1.618 Fibonacci level.
(4) $19,660 – the official Bitcoin all-time high according to Bitstamp BTC/USD chart.
It’s worth noting that BTC is now only a 9.05% rally shy of returning to its all-time high price – well within reach considering the asset has risen 16% in the last 3 days.
If confidence departs from the market and bears take back control of BTC, then there are a range of short-term supports that will likely get reactions:
(1) $17,933 – 0.618 Fibonacci level and a strong intraweek S/R level.
(2) $17,700 – Point of Control (blue line) that also overlaps with the hourly 50-EMA line.
(3) $17,480 – Approximate area of pennant pattern support (yellow line).
(4) $17,000 – Psychological level and order block support zone (green bar).
There is also a second major support bar around $16,700 (lowest green bar) that could also help prop up prices in the event of a strong bearish breakout from the pennant pattern. According to the VPVR indicator, the $15,400 level will most likely be the bottom if a heavy correction occurs.
Total market capital: $511 billion
Bitcoin market capital: $333 billion
Bitcoin dominance: 65.2%
*Data by Coingecko.
Bitstamp BTC/USD 1-Hour Chart