Bitcoin price has fallen under the psychological ,000 level today and is now tracking inside a descending triangle pattern on the 4-hour chart.These patterns form when the price consolidates between a sloping resistance and flat support (yellow lines). It’s usually a signal that bearish momentum is increasing and that the flat support will be overcome soon.Breakouts from this pattern tend to be quite extensive and require strong supports to provide bullish traders with an opportunity to push back. billion has left the global crypto market in the last 24 hours and Bitcoin dominance is back under the 70% mark.Price Levels to Watch in the Short-termOn the 4-hour BTC/USD chart, it’s clear that intraday selling pressure is increasing as BTC continues to print consecutive lower highs. The
Topics:
Ollie Leech considers the following as important: Bitcoin (BTC) Price, BTC Analysis, BTCEUR, BTCGBP, btcusd, btcusdt
This could be interesting, too:
Chayanika Deka writes XRP, SOL, and ADA Inclusion in US Crypto Reserve Pushes Traders on Edge
Chayanika Deka writes Why Arthur Hayes Is Bullish on Bitcoin Under Trump’s Economic Strategy
Mandy Williams writes Why the Bitcoin Market Is Stuck—and the Key Metric That Could Change It: CryptoQuant CEO
Wayne Jones writes Metaplanet Acquires 156 BTC, Bringing Total Holdings to 2,391
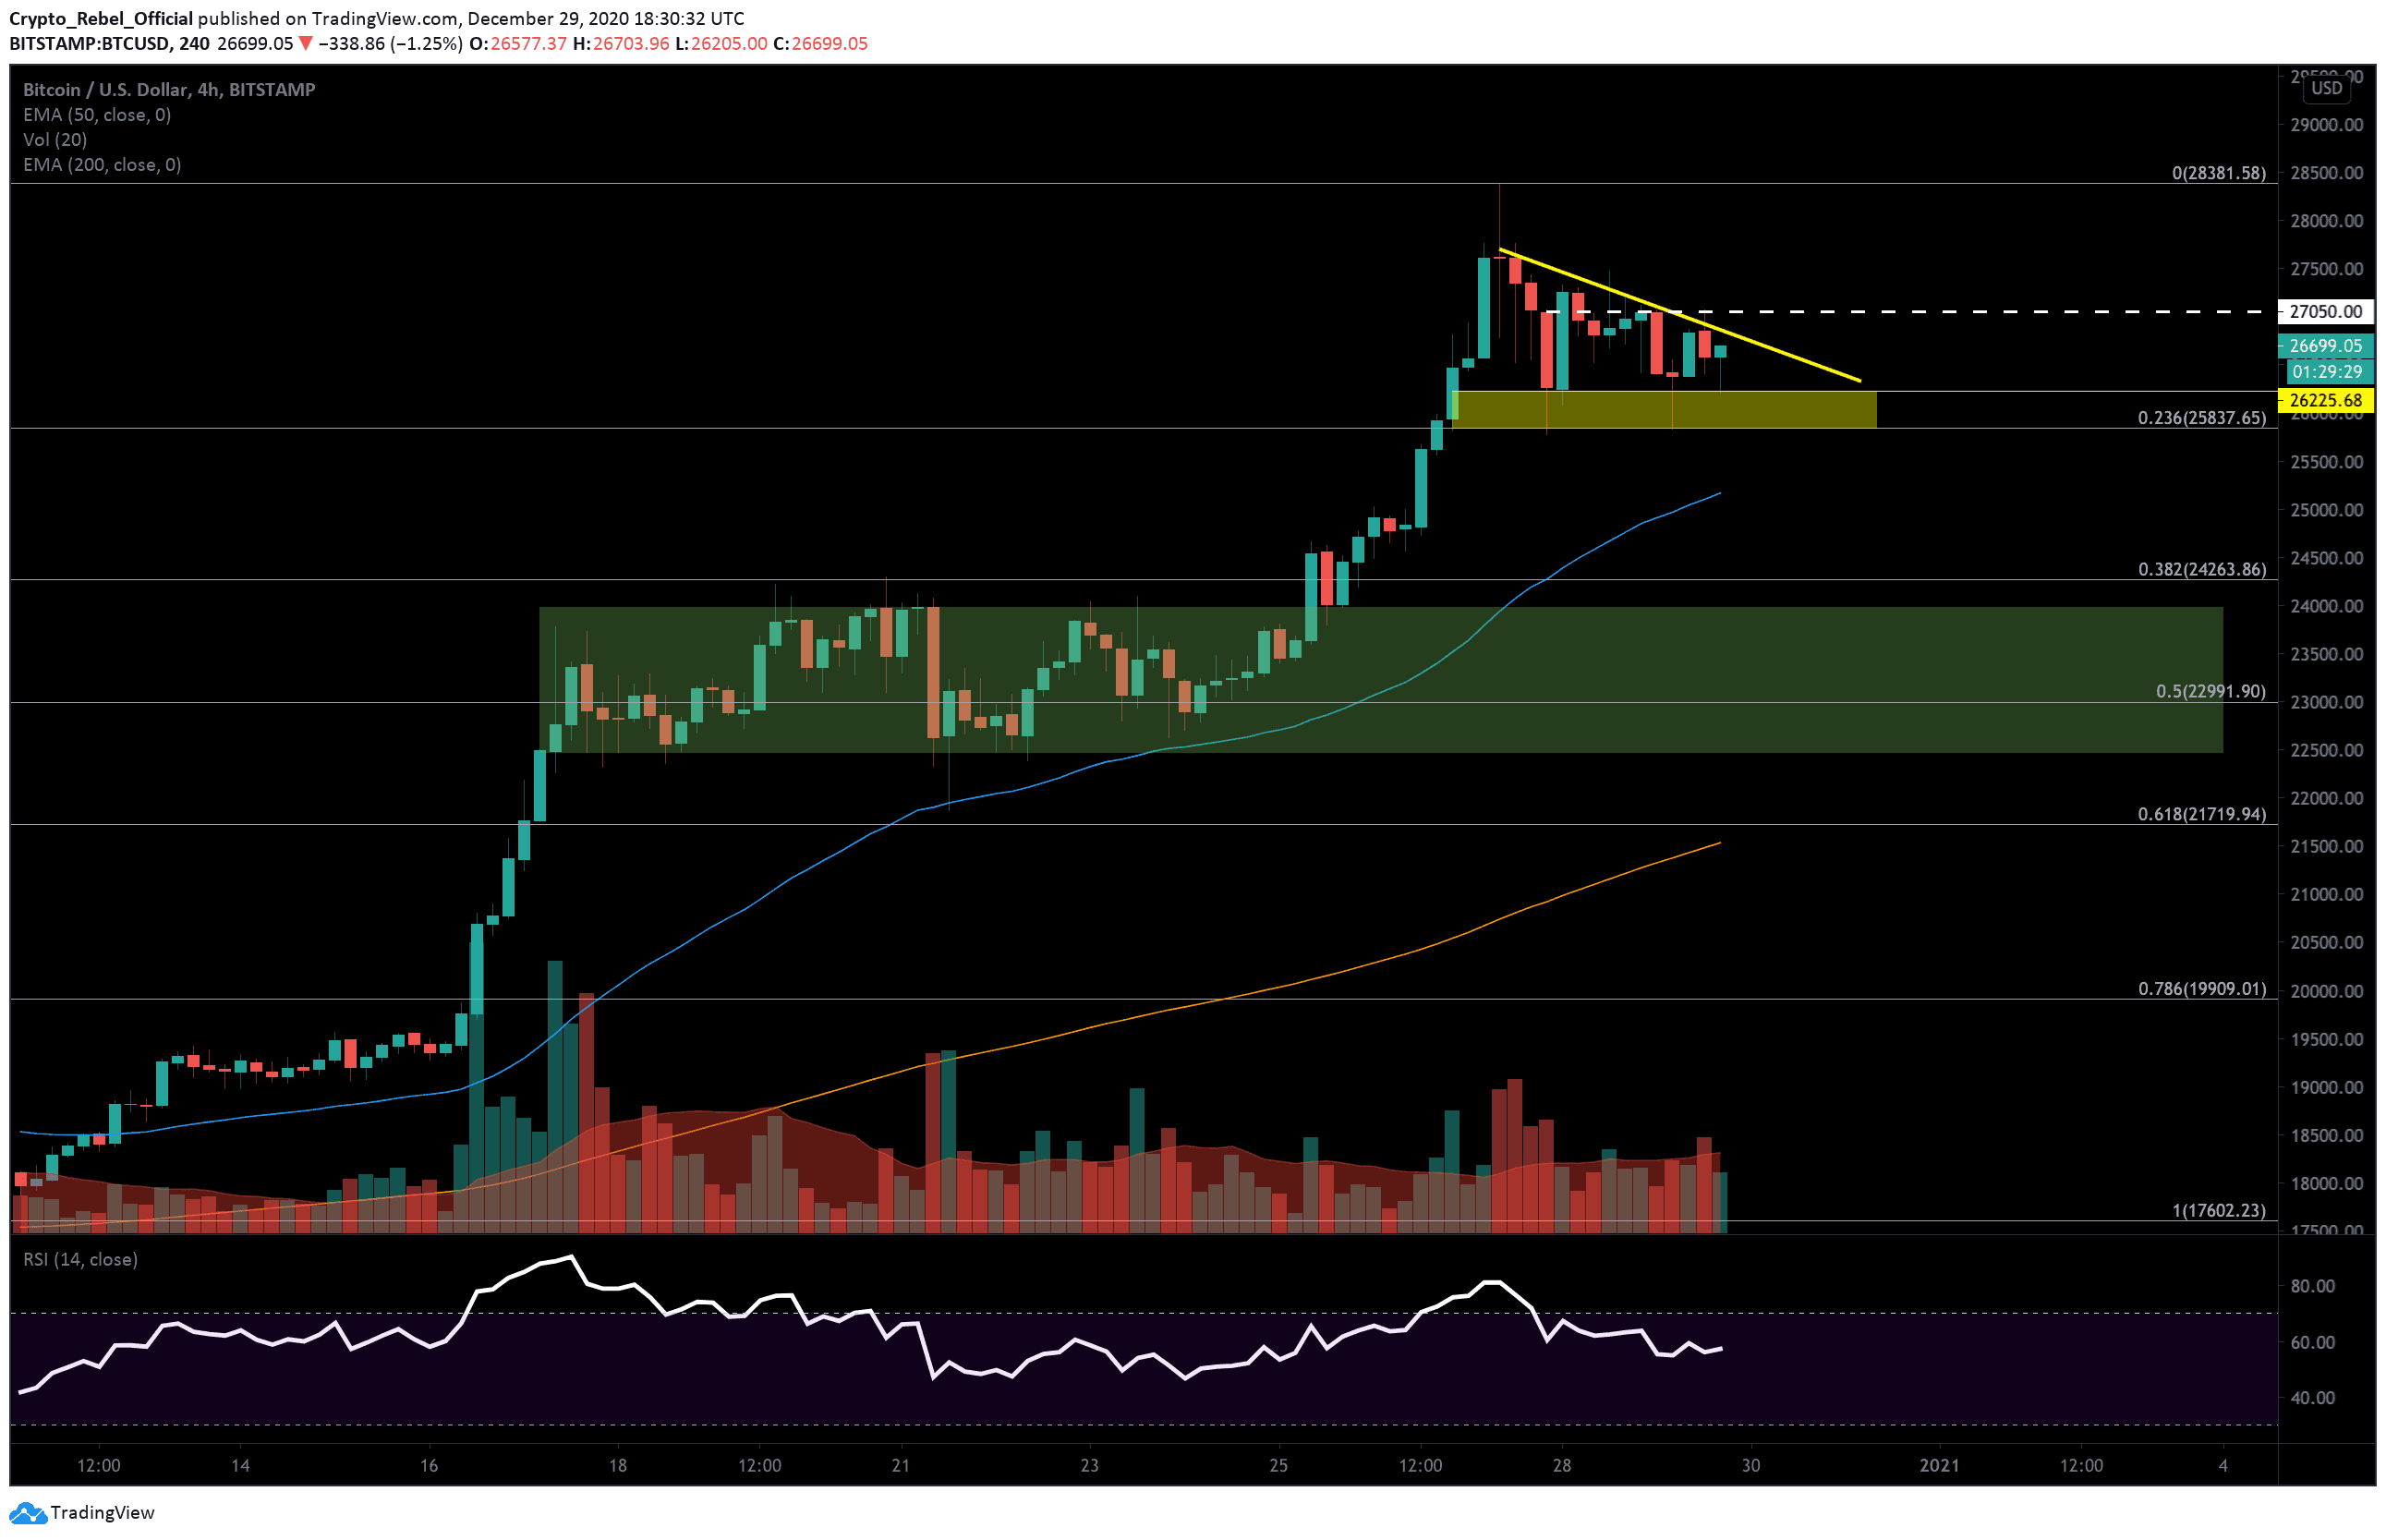
Bitcoin price has fallen under the psychological $27,000 level today and is now tracking inside a descending triangle pattern on the 4-hour chart.
These patterns form when the price consolidates between a sloping resistance and flat support (yellow lines). It’s usually a signal that bearish momentum is increasing and that the flat support will be overcome soon.
Breakouts from this pattern tend to be quite extensive and require strong supports to provide bullish traders with an opportunity to push back.
$15 billion has left the global crypto market in the last 24 hours and Bitcoin dominance is back under the 70% mark.
Price Levels to Watch in the Short-term
On the 4-hour BTC/USD chart, it’s clear that intraday selling pressure is increasing as BTC continues to print consecutive lower highs. The flat support for the descending triangle pattern is around $26,225, so a close beneath this level will confirm the bearish breakout has begun.
There is also another key support level just under this at the 0.236 Fibonacci retracement level at $23,857 which has caught the bottom of two dips during the last 48 hours. This could get a third reaction during the initial breakout.
If the descending triangle plays out, then we should look to the following areas as the most likely supports in the short-term;
(1) $25,200 – the 4-hour 50 EMA (blue).
(2) $24,263 – 0.382 Fibonacci retracement level.
(3) $24,000 – Key psychological level.
If the price does break all the way back down to $24,000, Bitcoin will be in danger of falling back inside the range between $24,000 and $22,470 that it was stuck in between December 17-25 (green shaded zone). In here, we could see volatility drop off and the price push sideways again for a second time as traders wait for more certainty in the market.
Underneath this range, there is a very strong backup support at the 0.618 Fibonacci level which also overlaps with the 200-EMA (red) at $21,720, which should provide a solid platform for bullish traders to rebound from in the event that prices slip out of the range.
For now, the main short-term resistance that bulls need to break in order to keep Bitcoin in an uptrend is the $27,050 level (white dashed line). Above this, there’s the next psychological level at $28,000.
Bitstamp 4-Hour BTC/USD Chart