The global crypto market has risen another billion today, which has helped lift Bitcoin out of yesterday’s bearish descending triangle and onwards towards a new all-time high at ,800.Despite the increase in investment entering the market over the last 24 hours, the overall trading volume has actually declined by billion.This, coupled with the fact that there is a substantial RSI divergence on the Bitcoin price chart right now, suggests that the current bullish trend is weakening and that the leading cryptocurrency might correct soon.January has almost always been a bearish time for Bitcoin and the wider crypto market, particularly after the late 2017 rally. It’s plausible that the current rally could provide an attempt to pump up buying pressure, surpassing K, so that larger
Topics:
Ollie Leech considers the following as important: Bitcoin (BTC) Price, BTC Analysis, BTCEUR, BTCGBP, btcusd, btcusdt
This could be interesting, too:
Chayanika Deka writes XRP, SOL, and ADA Inclusion in US Crypto Reserve Pushes Traders on Edge
Chayanika Deka writes Why Arthur Hayes Is Bullish on Bitcoin Under Trump’s Economic Strategy
Mandy Williams writes Why the Bitcoin Market Is Stuck—and the Key Metric That Could Change It: CryptoQuant CEO
Wayne Jones writes Metaplanet Acquires 156 BTC, Bringing Total Holdings to 2,391
The global crypto market has risen another $30 billion today, which has helped lift Bitcoin out of yesterday’s bearish descending triangle and onwards towards a new all-time high at $28,800.
Despite the increase in investment entering the market over the last 24 hours, the overall trading volume has actually declined by $10 billion.
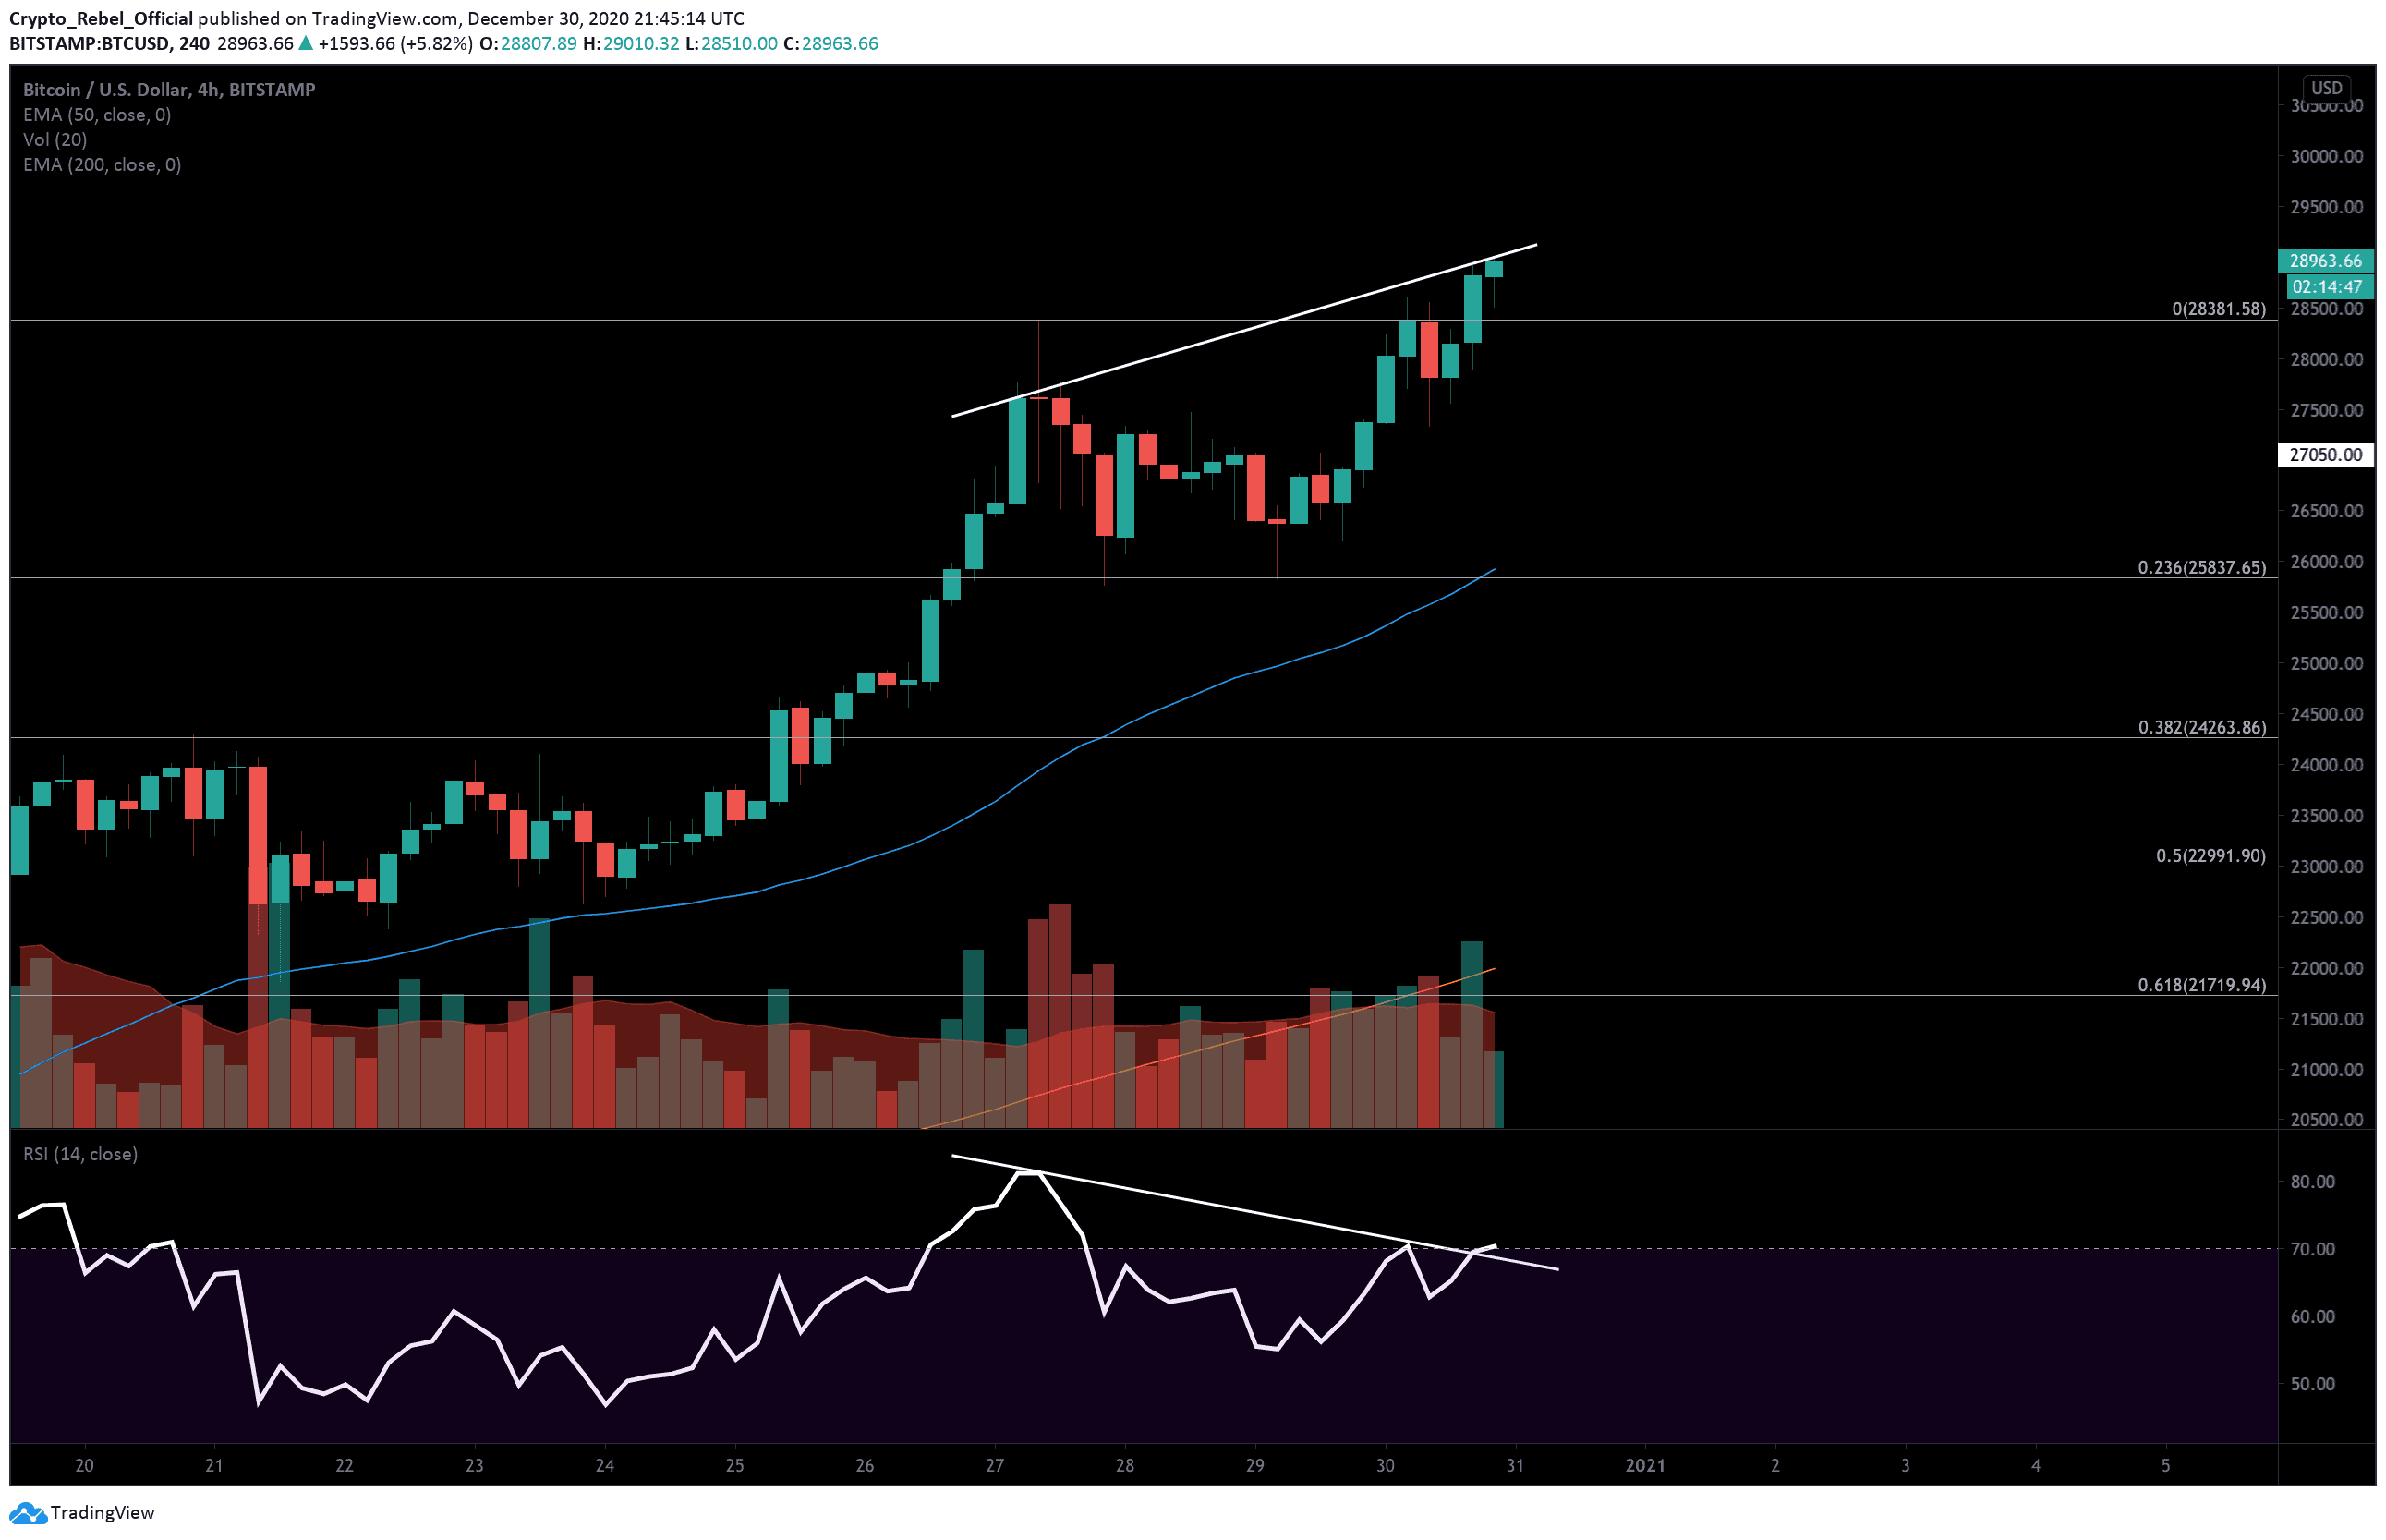
This, coupled with the fact that there is a substantial RSI divergence on the Bitcoin price chart right now, suggests that the current bullish trend is weakening and that the leading cryptocurrency might correct soon.
January has almost always been a bearish time for Bitcoin and the wider crypto market, particularly after the late 2017 rally. It’s plausible that the current rally could provide an attempt to pump up buying pressure, surpassing $30K, so that larger investors can offload their bags on to retail investors just after we enter the new year.
BTC Price Levels to Watch in the Short-term
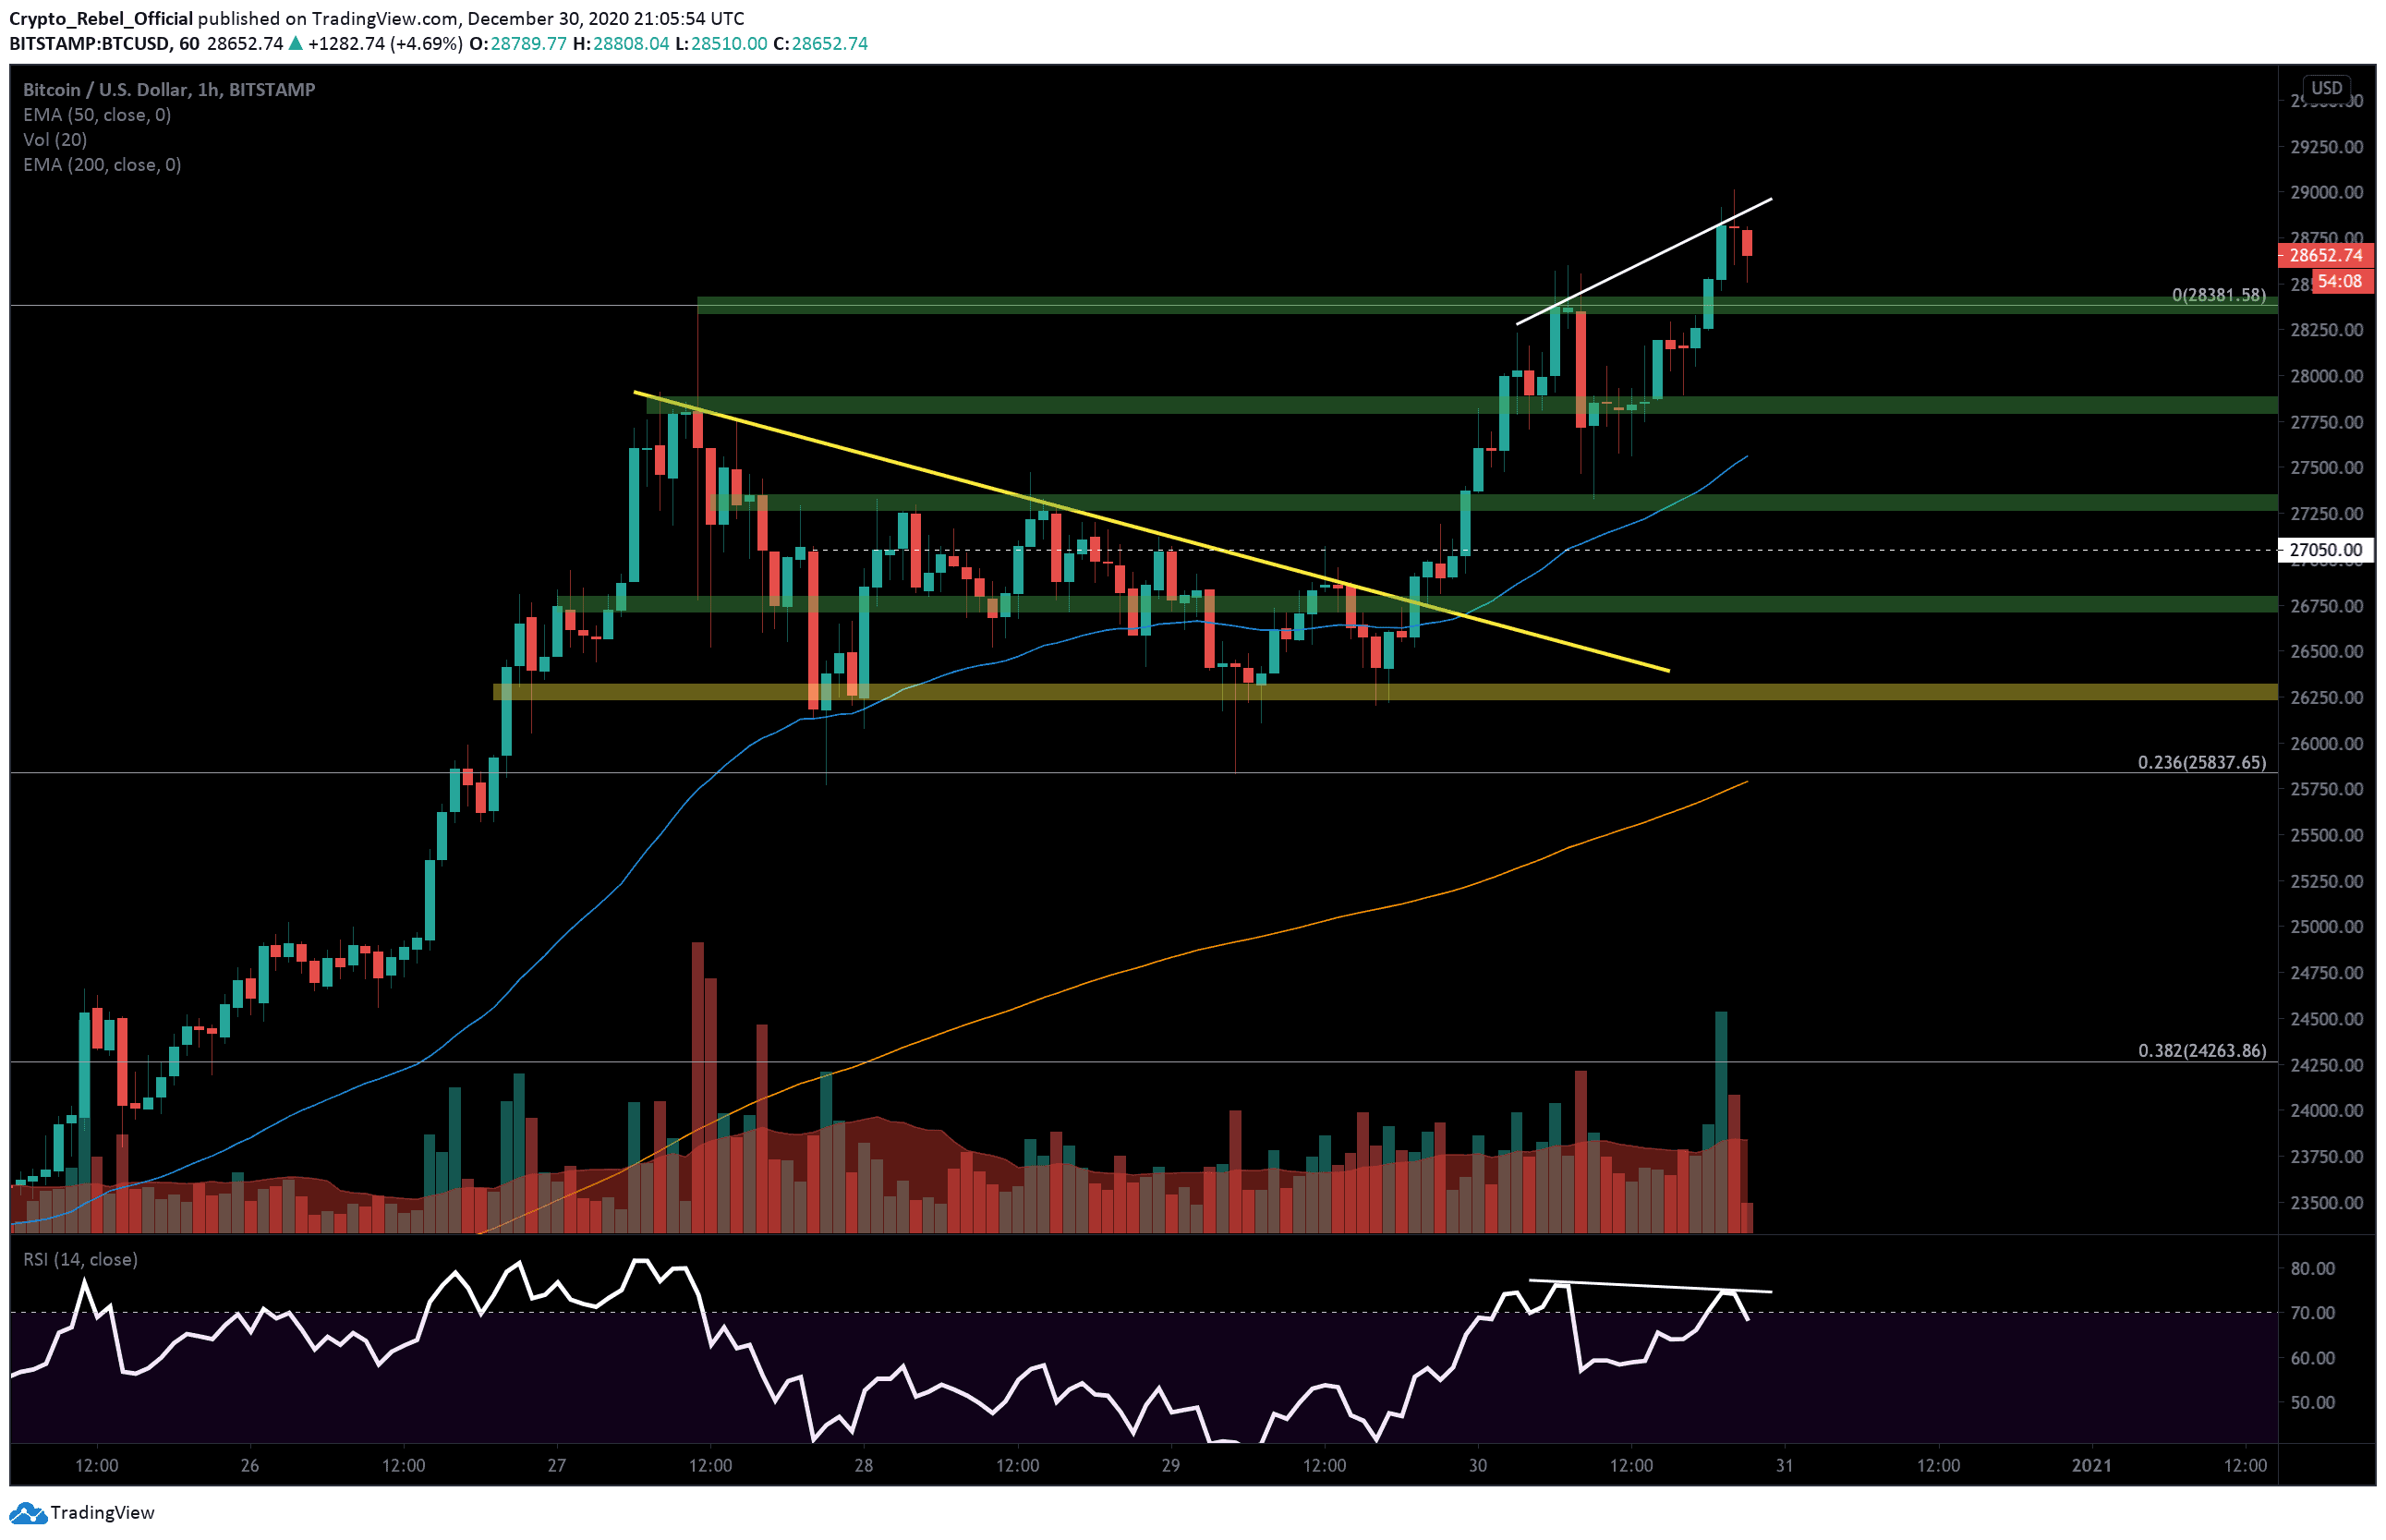
On the following hourly BTC/USD chart, we can see that the breakout level we discussed in the last analysis, around $27,050 (white dashed lines), was hit once bitcoin rejected the descending triangle pattern.
This resistance managed to keep prices suppressed for 3 hours until bullish traders finally broke through and drove Bitcoin back to $28,000.
Prices then began to stagnate around the $28,400 level before tanking to $27,300 during the start of the European trading session this morning (08:00-09:00 UTC).
Since then, bullish momentum picked up just as the U.S. trading session got underway, attempting to drive the leading crypto over $29K, as of writing these lines.
There is, however, a strong bearish RSI divergence on the 4-hour and hourly chart (white lines) that highlights the current uptrend may be running out of steam. RSI divergences are typically reliable indications that a trend is about to reverse.
If this plays out, these main support areas should help get some reactions once bears take back control of the asset.
(1) $28,400 – Top green bar and the previous all-time high.
(2) $27,850 – next green bar down from the top and key S/R level.
(3) $27,300 – third green bar.
(4) $26,750 – bottom green bar.
(5) $26,300 – yellow bar.
Total market capital: $773 billion
Bitcoin market capital: $536 billion
Bitcoin dominance: 69.3%
*Data by Coingecko.
Bitstamp BTC/USD 1-Hour Chart
Bitstamp BTC/USD 4-Hour Chart