Bitcoin bulls have successfully regained the ,000 level today after breaking bullish from a pennant pattern formed yesterday – Saturday, November 28.Over the course of this weekend so far, billion has returned to the global crypto market, which now stands at 0 billion. This has allowed the leading cryptocurrency to recover ,900 of the ,250 shed during the sharp correction between November 25-26.This speedy return of bullish momentum puts Bitcoin in a great position ahead of the return of US traders from their Thanksgiving hiatus, who will likely want to join in with buying up the dip.BTC Key Levels to Watch in the Short-termThe following 4-Hour BTC/USD chart shows that prices have run into a strong resistance zone (lowest red bar) between the 0.618 Fibonacci level at ,240
Topics:
Ollie Leech considers the following as important: Bitcoin (BTC) Price, BTC Analysis, BTCEUR, BTCGBP, btcusd, btcusdt
This could be interesting, too:
Chayanika Deka writes XRP, SOL, and ADA Inclusion in US Crypto Reserve Pushes Traders on Edge
Chayanika Deka writes Why Arthur Hayes Is Bullish on Bitcoin Under Trump’s Economic Strategy
Mandy Williams writes Why the Bitcoin Market Is Stuck—and the Key Metric That Could Change It: CryptoQuant CEO
Wayne Jones writes Metaplanet Acquires 156 BTC, Bringing Total Holdings to 2,391
Bitcoin bulls have successfully regained the $18,000 level today after breaking bullish from a pennant pattern formed yesterday – Saturday, November 28.
Over the course of this weekend so far, $30 billion has returned to the global crypto market, which now stands at $540 billion. This has allowed the leading cryptocurrency to recover $1,900 of the $3,250 shed during the sharp correction between November 25-26.
This speedy return of bullish momentum puts Bitcoin in a great position ahead of the return of US traders from their Thanksgiving hiatus, who will likely want to join in with buying up the dip.
BTC Key Levels to Watch in the Short-term
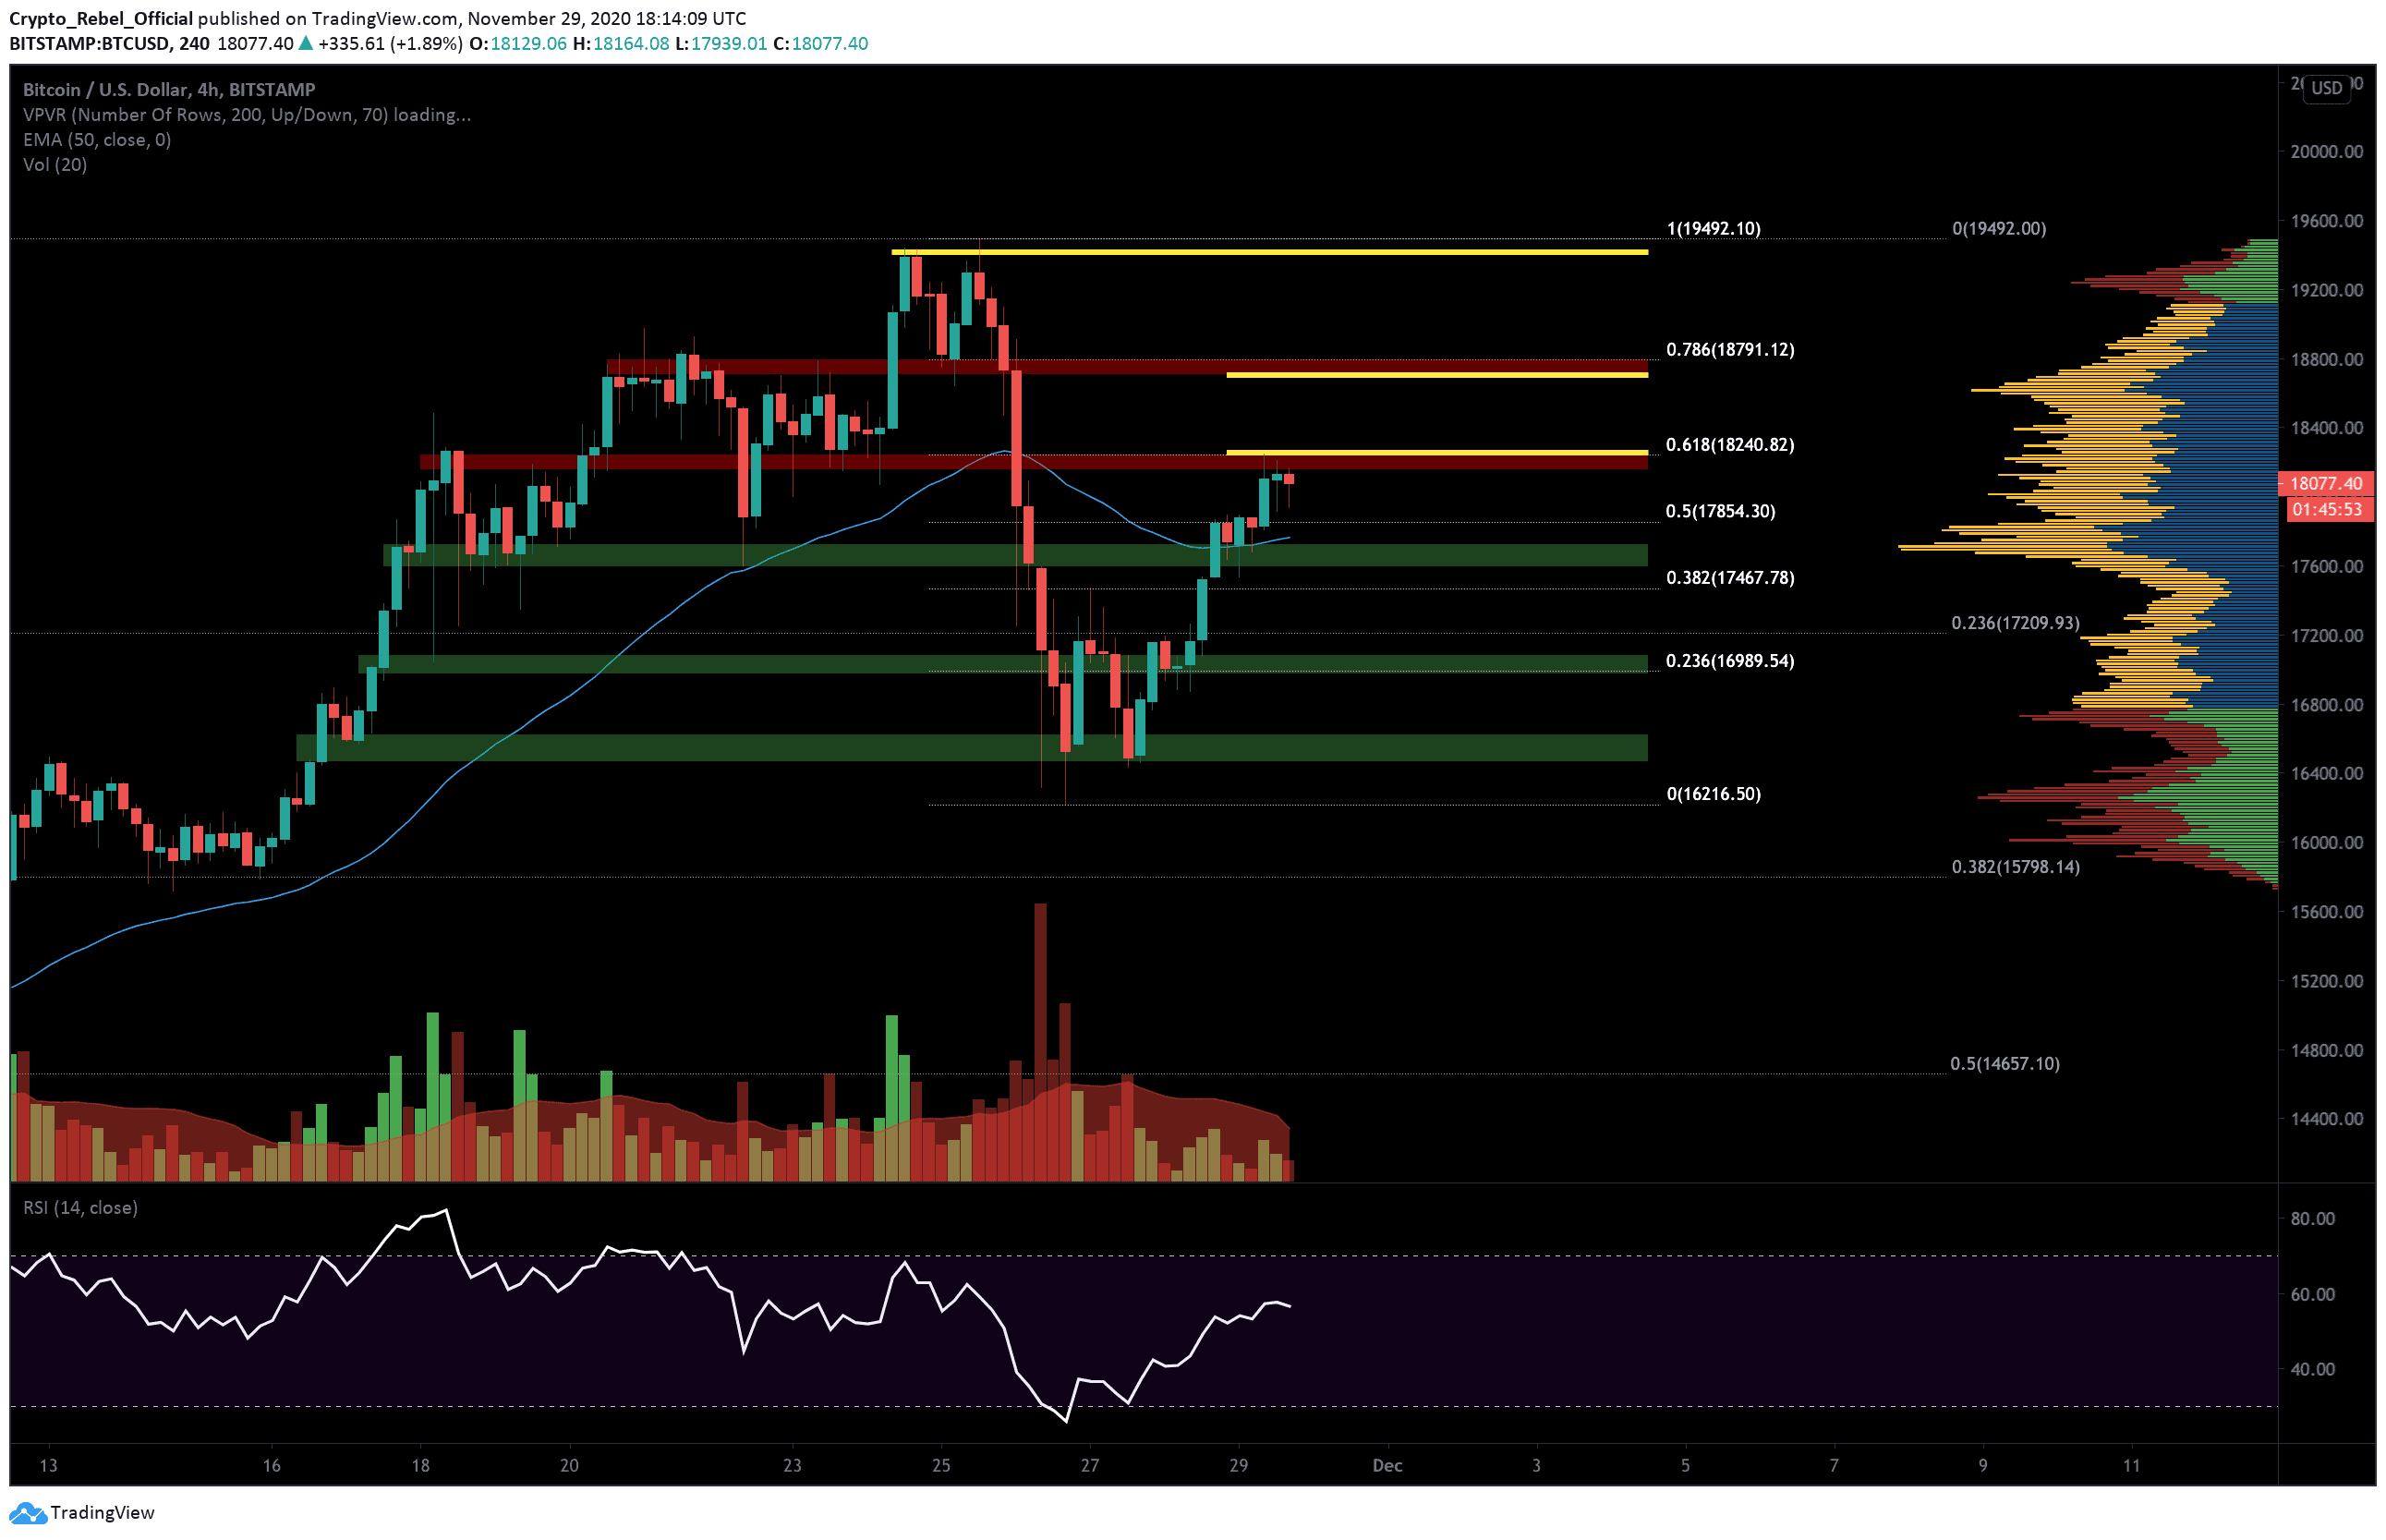
The following 4-Hour BTC/USD chart shows that prices have run into a strong resistance zone (lowest red bar) between the 0.618 Fibonacci level at $18,240 and $18,150 (lowest yellow line) that has pushed prices into a brief sideways consolidation.
This particular area has been a key S/R level for Bitcoin price for the last 11 days and will the main key area to break in the short-term before taking on the next set of resistances.
Above this level, we have the next major resistance zone between the 0.786 Fibonacci level at $18,791 and $18,700 (middle yellow line) that has recently seen high trading volumes and kept prices suppressed for 3 days during Bitcoin’s recent climb to its new YTD high.
The last top target for bullish traders in the short-term is the $19,440 level (top yellow line), which represents the highest 4-hour close on the chart. Breaking this level will put BTC within 1.14% of its highest price ever recorded at $19,660 (Bitstamp).
If additional bullish support fails to arrive once the US trading session begins tomorrow and BTC prices begin to tumble again, then we should expect to find support at the following levels:
(1) $17,854 – 0.5 Fibonacci level.
(2) $17,715 – first major support zone (top green bar) + 50 EMA line (blue).
(3) $17,150 – key resistance level.
(4) $16,460 – key S/R level.
Total market capital: $546 billion
Bitcoin market capital: $334 billion
Bitcoin dominance: 61.3%
*Data by Coingecko.
Bitstamp BTC/USD 4-Hour Chart