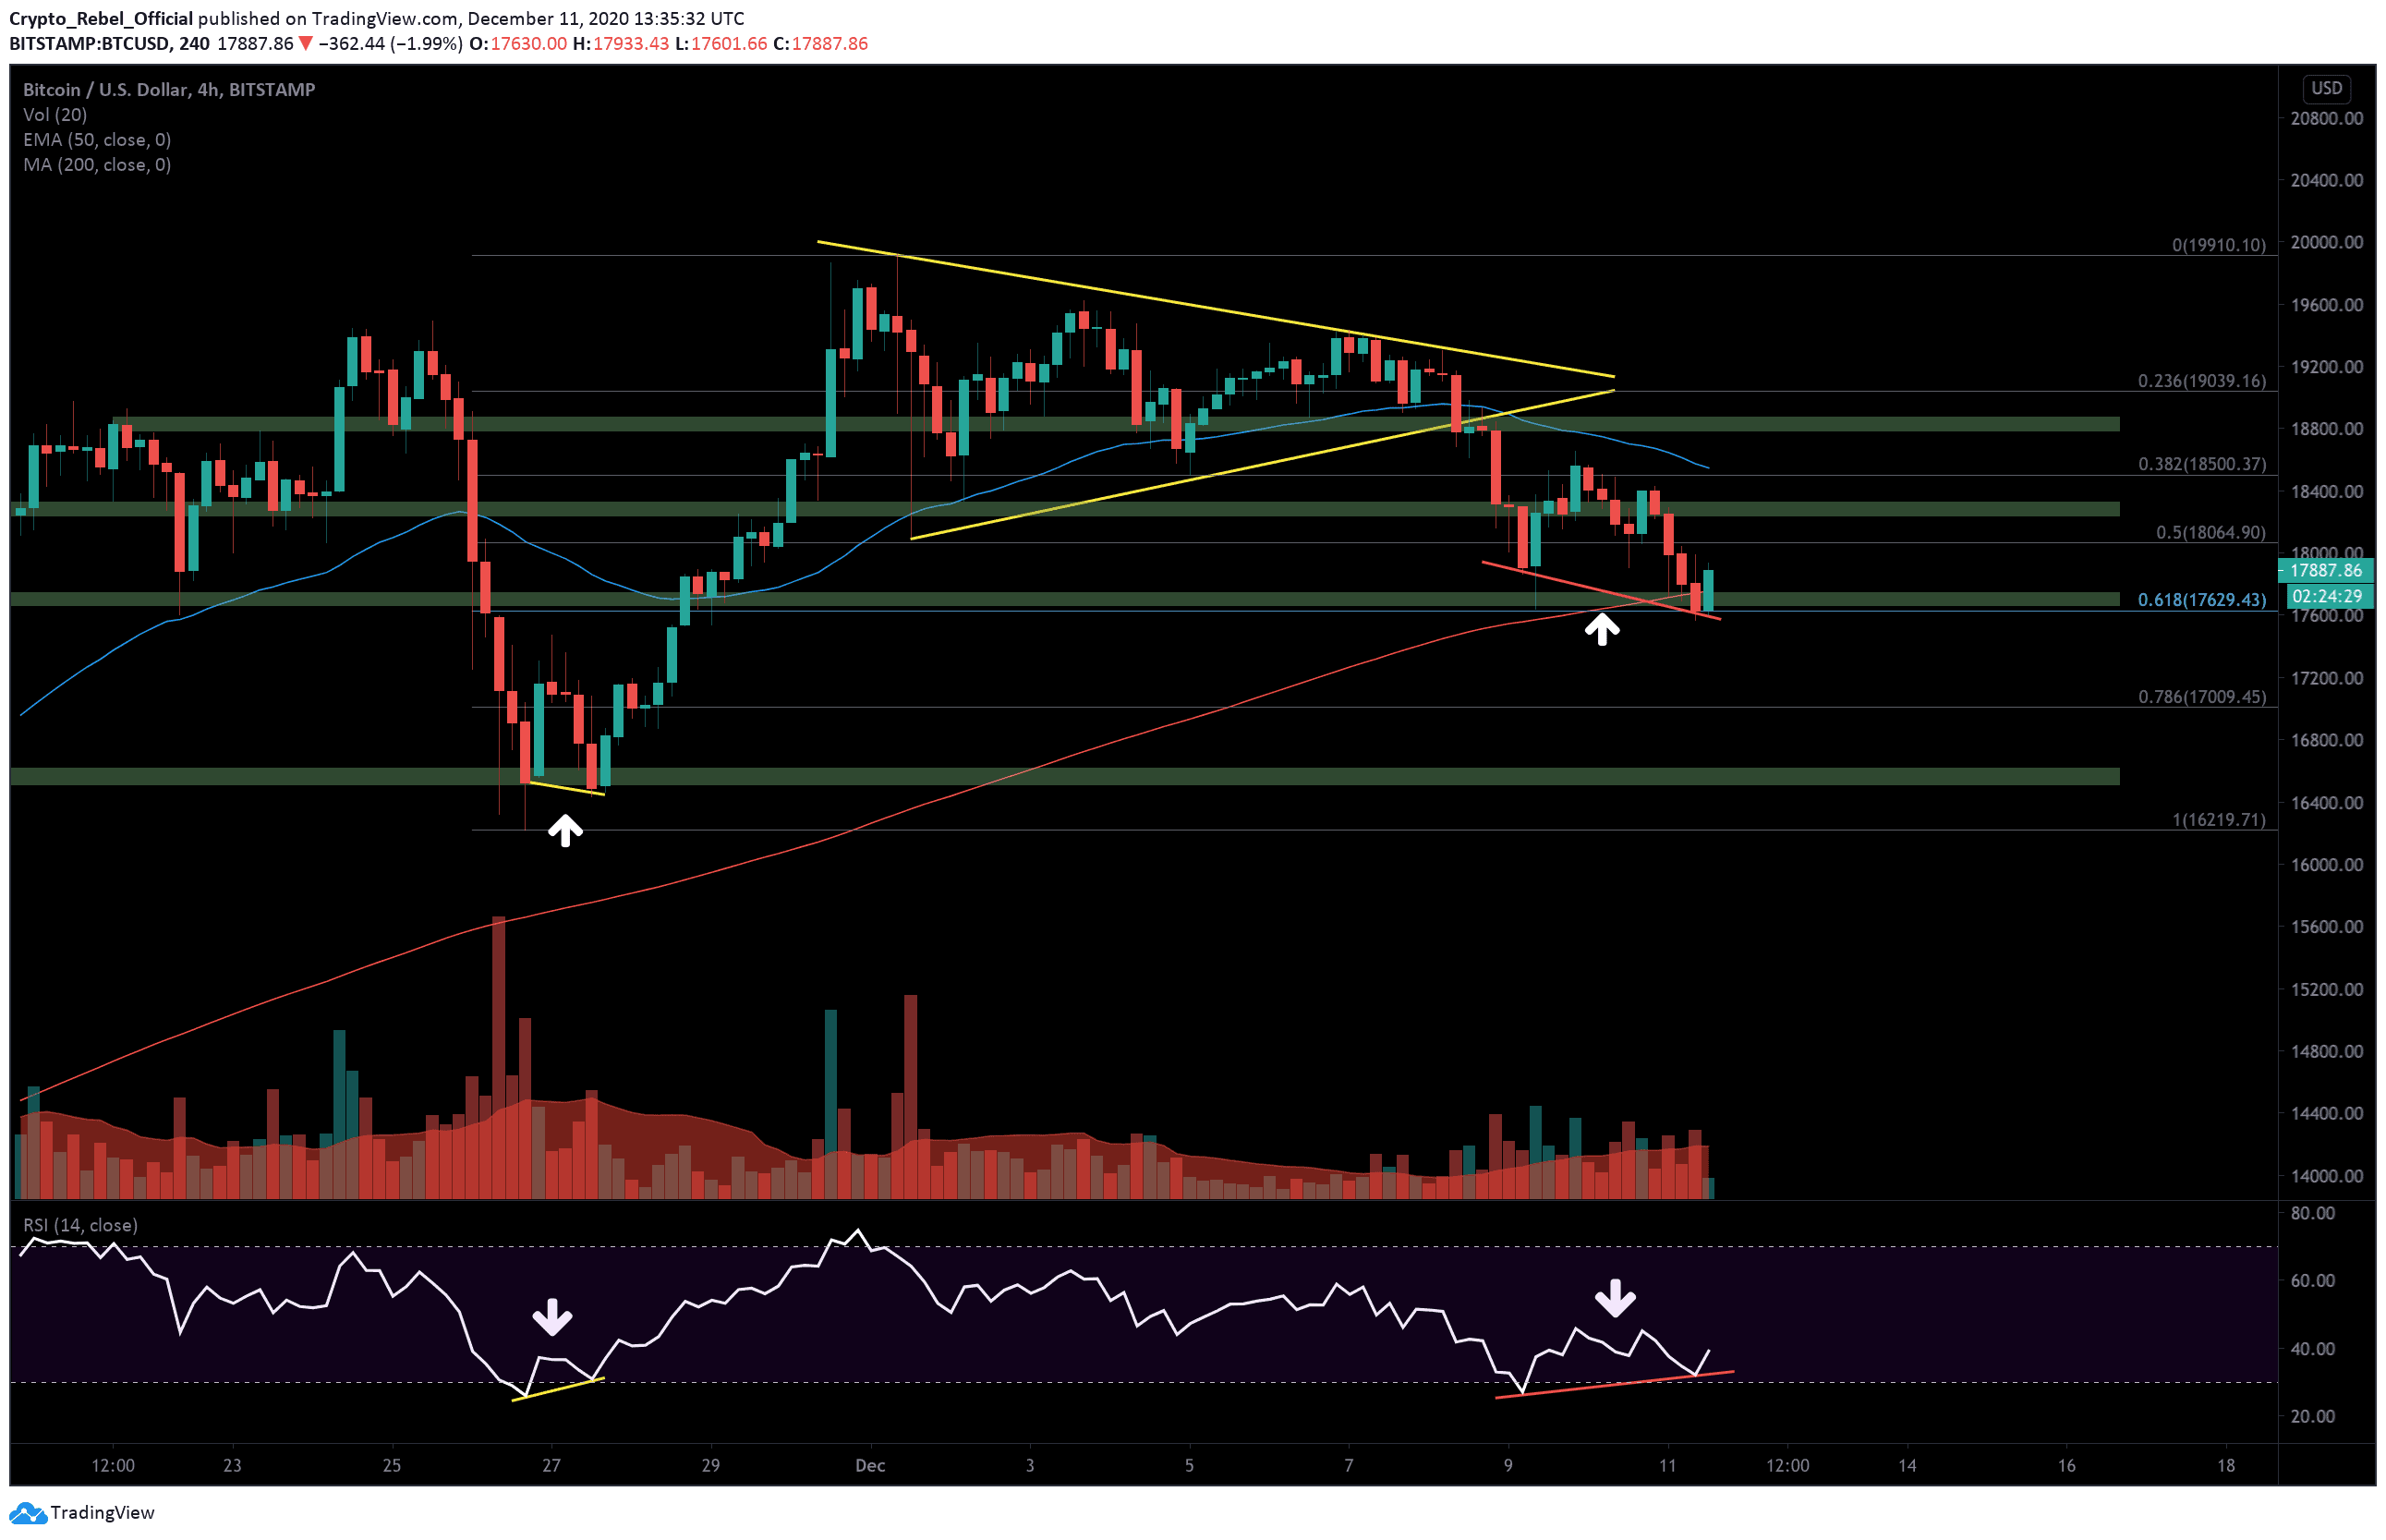
Bitcoin price continues to slide away from ,000 today and has now returned to the 4-hour 200 EMA line (red) for the first time since October 8th, 2020.Historically, this line has been a key long-term support for BTC and even though the leading crypto is inside the worrisome CME gap, it’s actually is getting a strong reaction from buyers right now.The global crypto market capital is now under the 5 billion mark, but there is an early sign that momentum could be about to flip bullish. On the RSI, we can see a bullish divergence (red lines + white arrows) between the RSI indicator line and current the price action. The former has printed a higher low back inside the index channel while the latter closed lower.Price Levels to Watch in the Short-termOn the 4-hour BTC/USD chart, we can see
Topics:
Ollie Leech considers the following as important: Bitcoin (BTC) Price, BTC Analysis, BTCEUR, BTCGBP, btcusd, btcusdt
This could be interesting, too:
Chayanika Deka writes XRP, SOL, and ADA Inclusion in US Crypto Reserve Pushes Traders on Edge
Chayanika Deka writes Why Arthur Hayes Is Bullish on Bitcoin Under Trump’s Economic Strategy
Mandy Williams writes Why the Bitcoin Market Is Stuck—and the Key Metric That Could Change It: CryptoQuant CEO
Wayne Jones writes Metaplanet Acquires 156 BTC, Bringing Total Holdings to 2,391
Bitcoin price continues to slide away from $18,000 today and has now returned to the 4-hour 200 EMA line (red) for the first time since October 8th, 2020.
Historically, this line has been a key long-term support for BTC and even though the leading crypto is inside the worrisome CME gap, it’s actually is getting a strong reaction from buyers right now.
The global crypto market capital is now under the $525 billion mark, but there is an early sign that momentum could be about to flip bullish. On the RSI, we can see a bullish divergence (red lines + white arrows) between the RSI indicator line and current the price action. The former has printed a higher low back inside the index channel while the latter closed lower.
Price Levels to Watch in the Short-term
On the 4-hour BTC/USD chart, we can see that prices have just rebounded off the 0.618 Fibonacci level (blue) at $17,629 and is reaching up towards the psychological level above. Trading volume is also showing a marked increase over the last 3 days which seems to suggest traders are returning to the market following the pennant bearish breakout earlier in the week.
The aforementioned RSI divergence on the chart is significantly stronger than the one we saw during the November 26-27 bottom that led to a 19%+ rise to Bitcoin’s new all-time high on the Bitstamp chart.
If this pattern is anything to go by, then we could see a similar surge take price back to the $18,800 level (top green bar) over the weekend if volume continues to improve. Before that, however, Bitcoin bulls will need to overcome the $18,400 level and the $18,500 mark which is now being reinforced by the 50-EMA line (blue).
Looking south, if bitcoin bears are able to maintain control over the asset and keep prices suppressed despite the divergence then the $17,260 mark, the 0.786 Fibonacci retracement level at $17,000, and $16,500 will likely provide strong support areas for the crypto-asset.
Total market capital: $536 billion
Bitcoin market capital: $332 billion
Bitcoin dominance: 61.9%
*Data by Coingecko
Bitstamp BTC/USD 4-Hour Chart