Bitcoin’s price is now back on the key S/R zone (top green bar) between ,900 and ,860, as low weekend trading volume puts the brakes on bullish momentum. Since setting a new high of ,475 on November 13, the leading crypto has printed 4 consecutive lower highs over the 4-hour time frame and is now tracking in a downtrending channel (blue channel). Global Crypto Market Capital chart by CoinmarketcapThe global crypto market capital has also broken away from its up-trending line (black), which has now flipped into a resistance and is even close to retesting the recent low at 2 billion (blue line). Printing a new lower low beneath this would signal a new bearish trend over the crypto market that could result in more downside to come during the week ahead. Price
Topics:
Ollie Leech considers the following as important: Bitcoin (BTC) Price, BTC Analysis, BTCEUR, BTCGBP, btcusd, btcusdt
This could be interesting, too:
Chayanika Deka writes XRP, SOL, and ADA Inclusion in US Crypto Reserve Pushes Traders on Edge
Chayanika Deka writes Why Arthur Hayes Is Bullish on Bitcoin Under Trump’s Economic Strategy
Mandy Williams writes Why the Bitcoin Market Is Stuck—and the Key Metric That Could Change It: CryptoQuant CEO
Wayne Jones writes Metaplanet Acquires 156 BTC, Bringing Total Holdings to 2,391
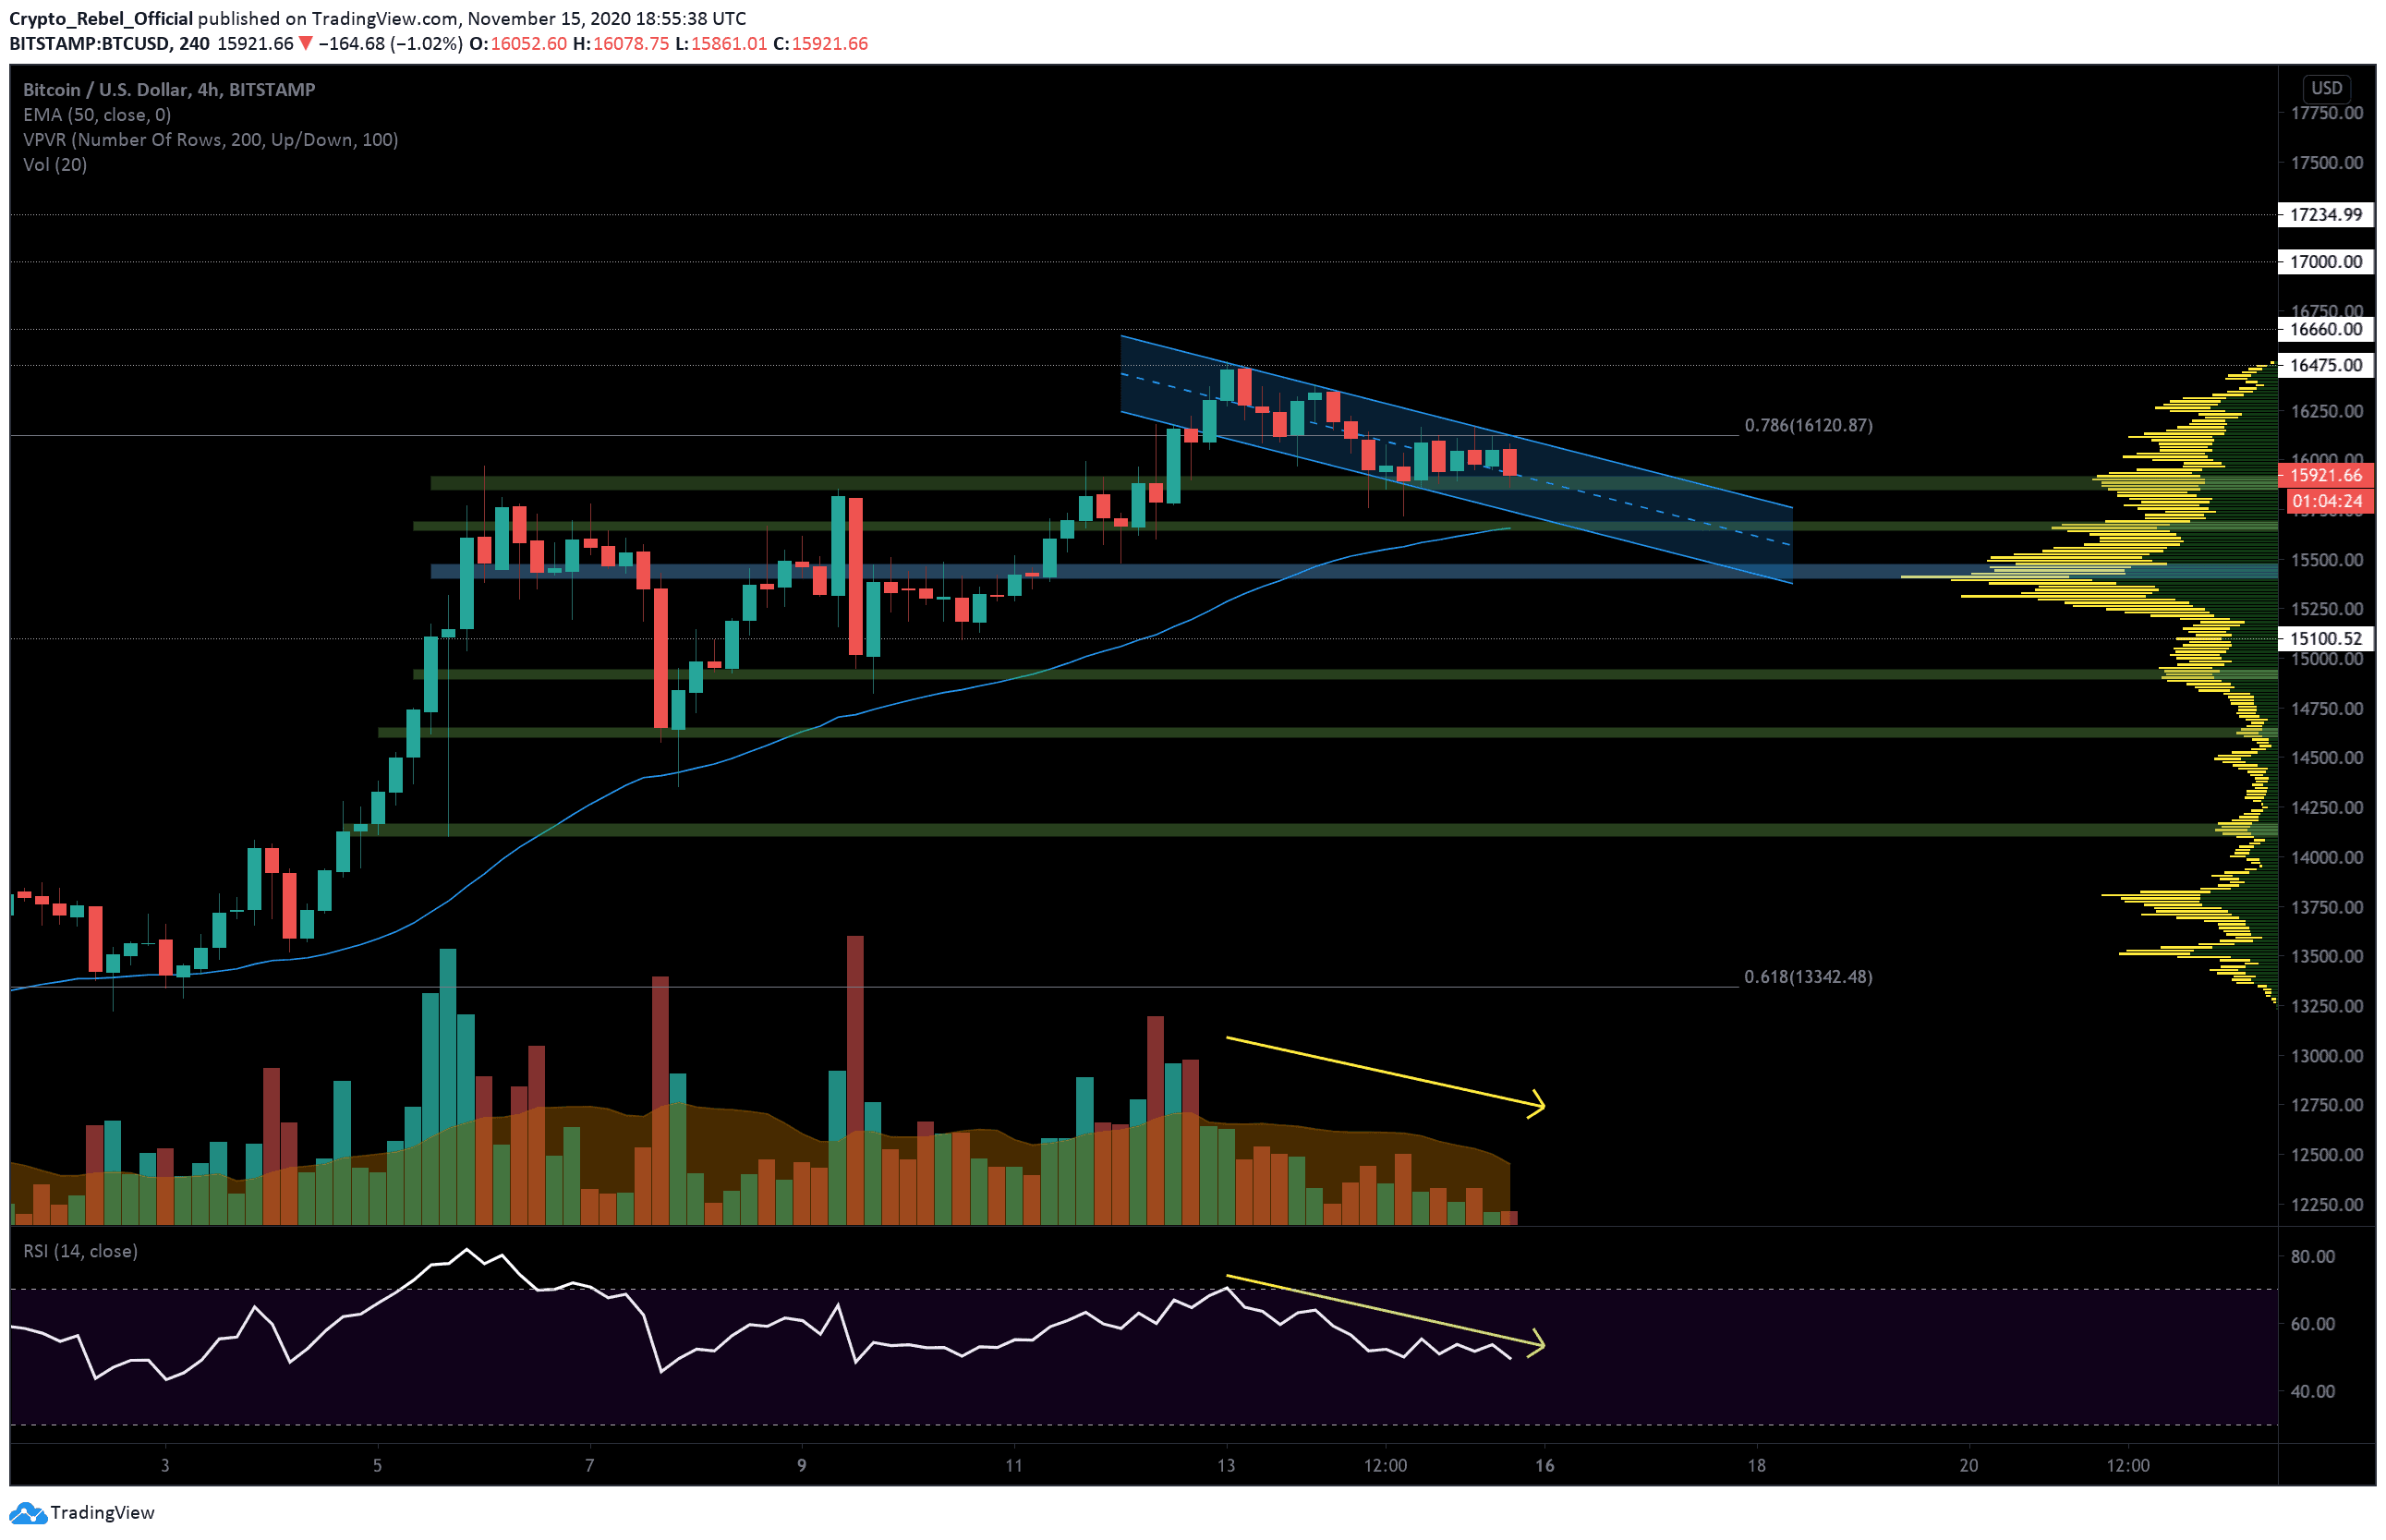
Bitcoin’s price is now back on the key S/R zone (top green bar) between $15,900 and $15,860, as low weekend trading volume puts the brakes on bullish momentum.
Since setting a new high of $16,475 on November 13, the leading crypto has printed 4 consecutive lower highs over the 4-hour time frame and is now tracking in a downtrending channel (blue channel).

The global crypto market capital has also broken away from its up-trending line (black), which has now flipped into a resistance and is even close to retesting the recent low at $452 billion (blue line). Printing a new lower low beneath this would signal a new bearish trend over the crypto market that could result in more downside to come during the week ahead.
Price Levels to Watch in the Short-term
On the 4-hour BTC/USD chart, we can see that the price action has pushed sideways over the last several candles between the 0.786 Fibonacci resistance at $16,120 and the aforementioned S/R zone. Right now, BTC is resting along the median line (dashed white line) of the channel as bulls attempt to keep prices in the upper half of the channel.
If trading volume and overall investment coming into the crypto market continues to drop, we should expect to see Bitcoin tumble towards the following lower supports;
(1) $15,700 – Where the lower channel support overlaps with the next major support zone (second green bar). This zone will also likely be reinforced by the 50-EMA (blue line).
(2) $15,410 – Point of Control (blue bar).
(3) $15,100 – Key S/R level.
(4) $14,900 – Third major support zone.
Should volume pick up as the traditional markets reopen for the week, then the immediate targets for bullish traders will be the 0.786 Fibonacci level at $16,120, $16,380, the current high at $16,475.
Once Bitcoin breaks into new territory, the next set of resistances that will likely stand in the way will be at $16,660, the psychological $17,000 level, and the January 2018 high of $17,234.
Total market capital: $461 billion
Bitcoin market capital: $294 billion
Bitcoin dominance: 63.9%
*Data by Coingecko.
Bitstamp BTC/USD 4-Hour Chart