We have now entered into Bitcoin’s worst month in terms of historical performance. On average, the leading crypto crashes 14% during the month of August.That being said, BTC price action appears to be falling in a bullish reversal pattern that suggests a spike to ,000. And this could happen very soon. The mentioned pattern is formed from Whale trader manipulation designed to shake out weak hands, before the price quickly retraces back to its former high.Let’s look into it in more detail.The Bullish Reversal PatternLooking at a fractal on the following 2-Hour BTC/USD from last year, May 2019, we can see a strong reversal pattern that has a number of clear characteristics.BTC/USD chart via Tradingview1. A sharp decline, which retraces around 50% before closing.2. Then, a short period of
Topics:
Ollie Leech considers the following as important: Bitcoin (BTC) Price, BTC Analysis, BTCEUR, BTCGBP, btcusd, btcusdt
This could be interesting, too:
Chayanika Deka writes XRP, SOL, and ADA Inclusion in US Crypto Reserve Pushes Traders on Edge
Chayanika Deka writes Why Arthur Hayes Is Bullish on Bitcoin Under Trump’s Economic Strategy
Mandy Williams writes Why the Bitcoin Market Is Stuck—and the Key Metric That Could Change It: CryptoQuant CEO
Wayne Jones writes Metaplanet Acquires 156 BTC, Bringing Total Holdings to 2,391
We have now entered into Bitcoin’s worst month in terms of historical performance. On average, the leading crypto crashes 14% during the month of August.
That being said, BTC price action appears to be falling in a bullish reversal pattern that suggests a spike to $12,000. And this could happen very soon. The mentioned pattern is formed from Whale trader manipulation designed to shake out weak hands, before the price quickly retraces back to its former high.
Let’s look into it in more detail.
The Bullish Reversal Pattern
Looking at a fractal on the following 2-Hour BTC/USD from last year, May 2019, we can see a strong reversal pattern that has a number of clear characteristics.

1. A sharp decline, which retraces around 50% before closing.
2. Then, a short period of low volatility pushes the price action sideways.
3. The sideways volatility creates a lower low, followed by a higher low.
4. The pattern then completes by completely retracing back to the former high before the first sharp decline.
This is likely the result of a large whale trader crashing the price in order to trigger stop losses and cause panic in the market. This panic translates to an increase in selling pressure, which provides the Whale with enough liquidity to buy back into BTC at a much better price than before.
It’s a simple tactic and almost always works. This is mostly due to inexperienced traders being more prone to emotional trading and ‘chasing the market.’
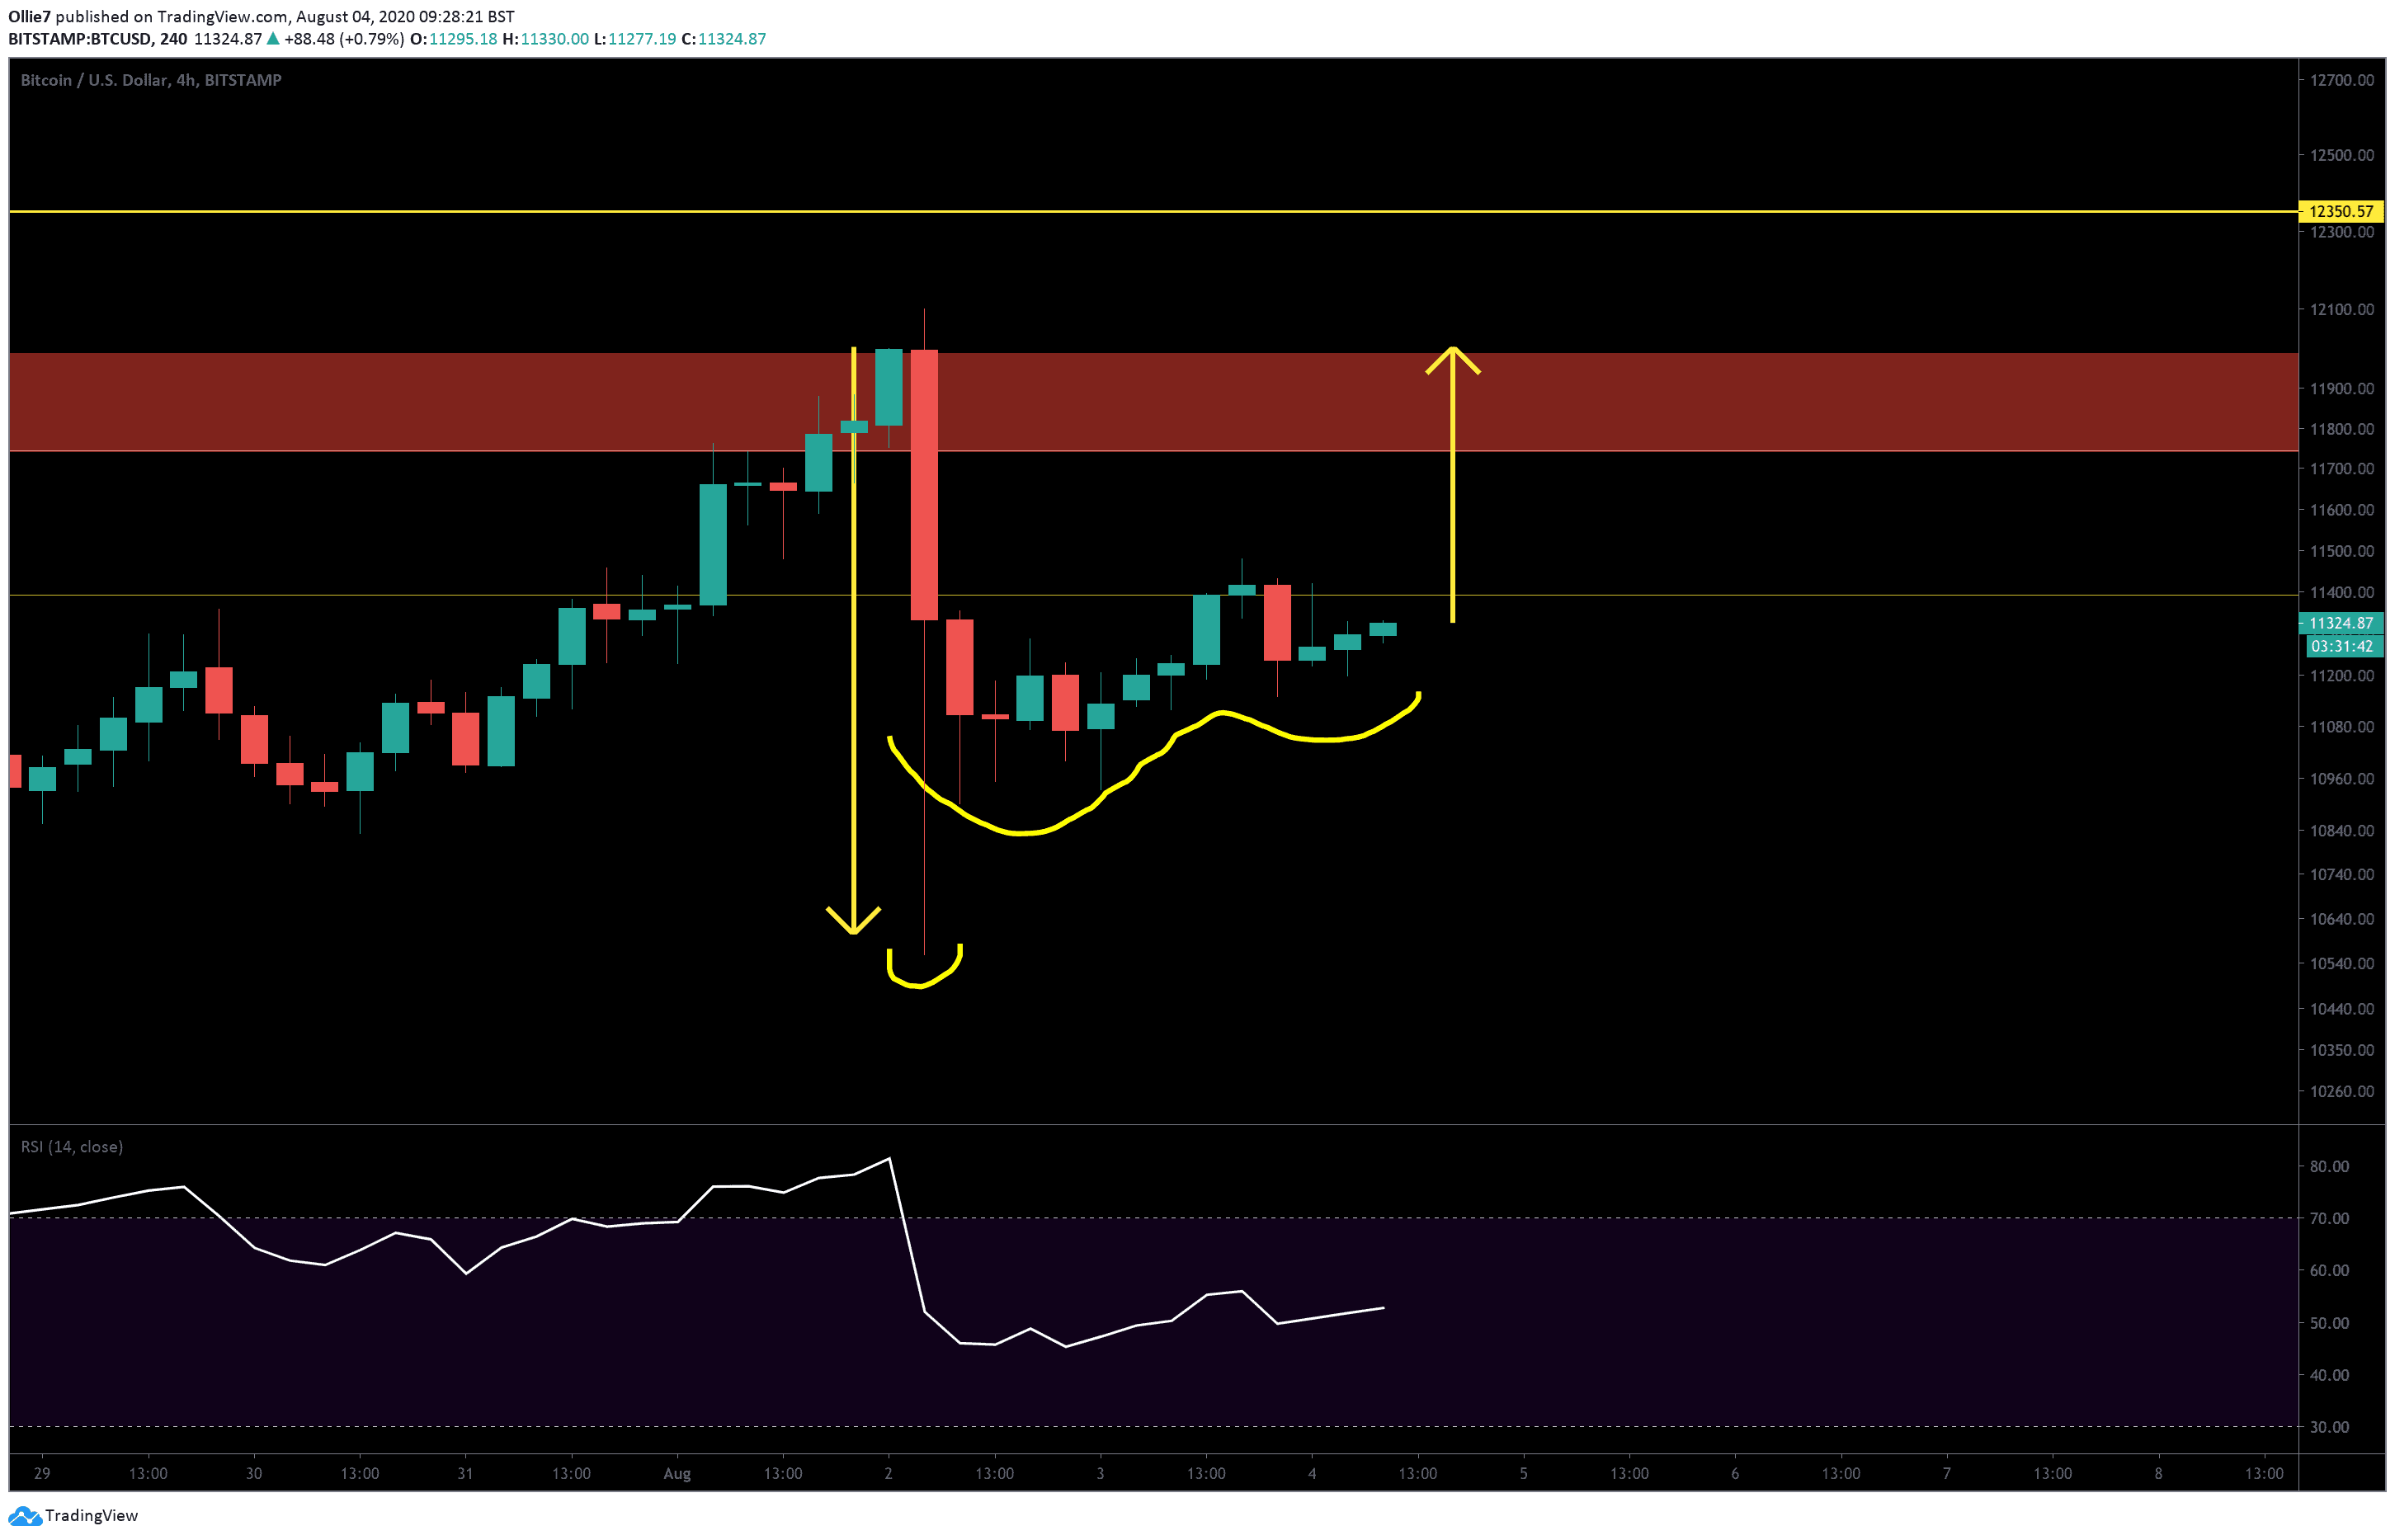
Looking at the above 4-Hour BTC/USD chart right now, we can identify these same characteristics in the current price action.
1. We already have a sharp decline, which retraces around 50% at the close.
2. The price has already pushed sideways and printed a lower low, followed by a higher low.
Now, all we’re waiting for is the retracement surge back to the former high – around $12,000, which roughly a 6% increase from the current price levels.
Bitcoin Price Levels to Watch in the Short-term
If the pattern is playing out, and BTC prices return to $12,000, we should expect some pullback and perhaps a period of sideways action, before bulls take on the next resistance.
After $12,000, the next likely hurdle to overcome will be the strong daily resistance at $12,350. If prices break above this point, it will set a new yearly high record for Bitcoin.
If the pattern gets rejected and breaks to the downside, then the 50EMA will be the first foothold for bullish traders to recover from. The $10,800 below could also provide some intraday support. If that fails, then we have another support at the $10,280 order block beneath.
Total Market Capital: $352 billion
Bitcoin Market Capital: $208 billion
Bitcoin Dominance: 59.2%