Bitcoin bulls need to make sure the daily price closes above ,850 today, or else a double top will form on the BTC/USD chart (see below).Double tops are bearish reversal setups that tend to result in strong downtrends. They form when an asset fails to breach the same resistance level twice in a short period of time. The second rejection signals to the market that bullish momentum has run out and that a shift in trend is about to occur.There’s also an obvious RSI divergence (yellow line) over the same timeframe, which supports the current trend weakening idea. Not to mention, billion has departed from the market since 00:01 (GMT) today, as the Bitcoin dominance is breaking records.BTC Price Levels to Watch in the Short-termOn the 4-hour BTC/USD chart, we can see the price has failed
Topics:
Ollie Leech considers the following as important: Bitcoin (BTC) Price, BTC Analysis, BTCEUR, BTCGBP, btcusd, btcusdt
This could be interesting, too:
Chayanika Deka writes XRP, SOL, and ADA Inclusion in US Crypto Reserve Pushes Traders on Edge
Chayanika Deka writes Why Arthur Hayes Is Bullish on Bitcoin Under Trump’s Economic Strategy
Mandy Williams writes Why the Bitcoin Market Is Stuck—and the Key Metric That Could Change It: CryptoQuant CEO
Wayne Jones writes Metaplanet Acquires 156 BTC, Bringing Total Holdings to 2,391
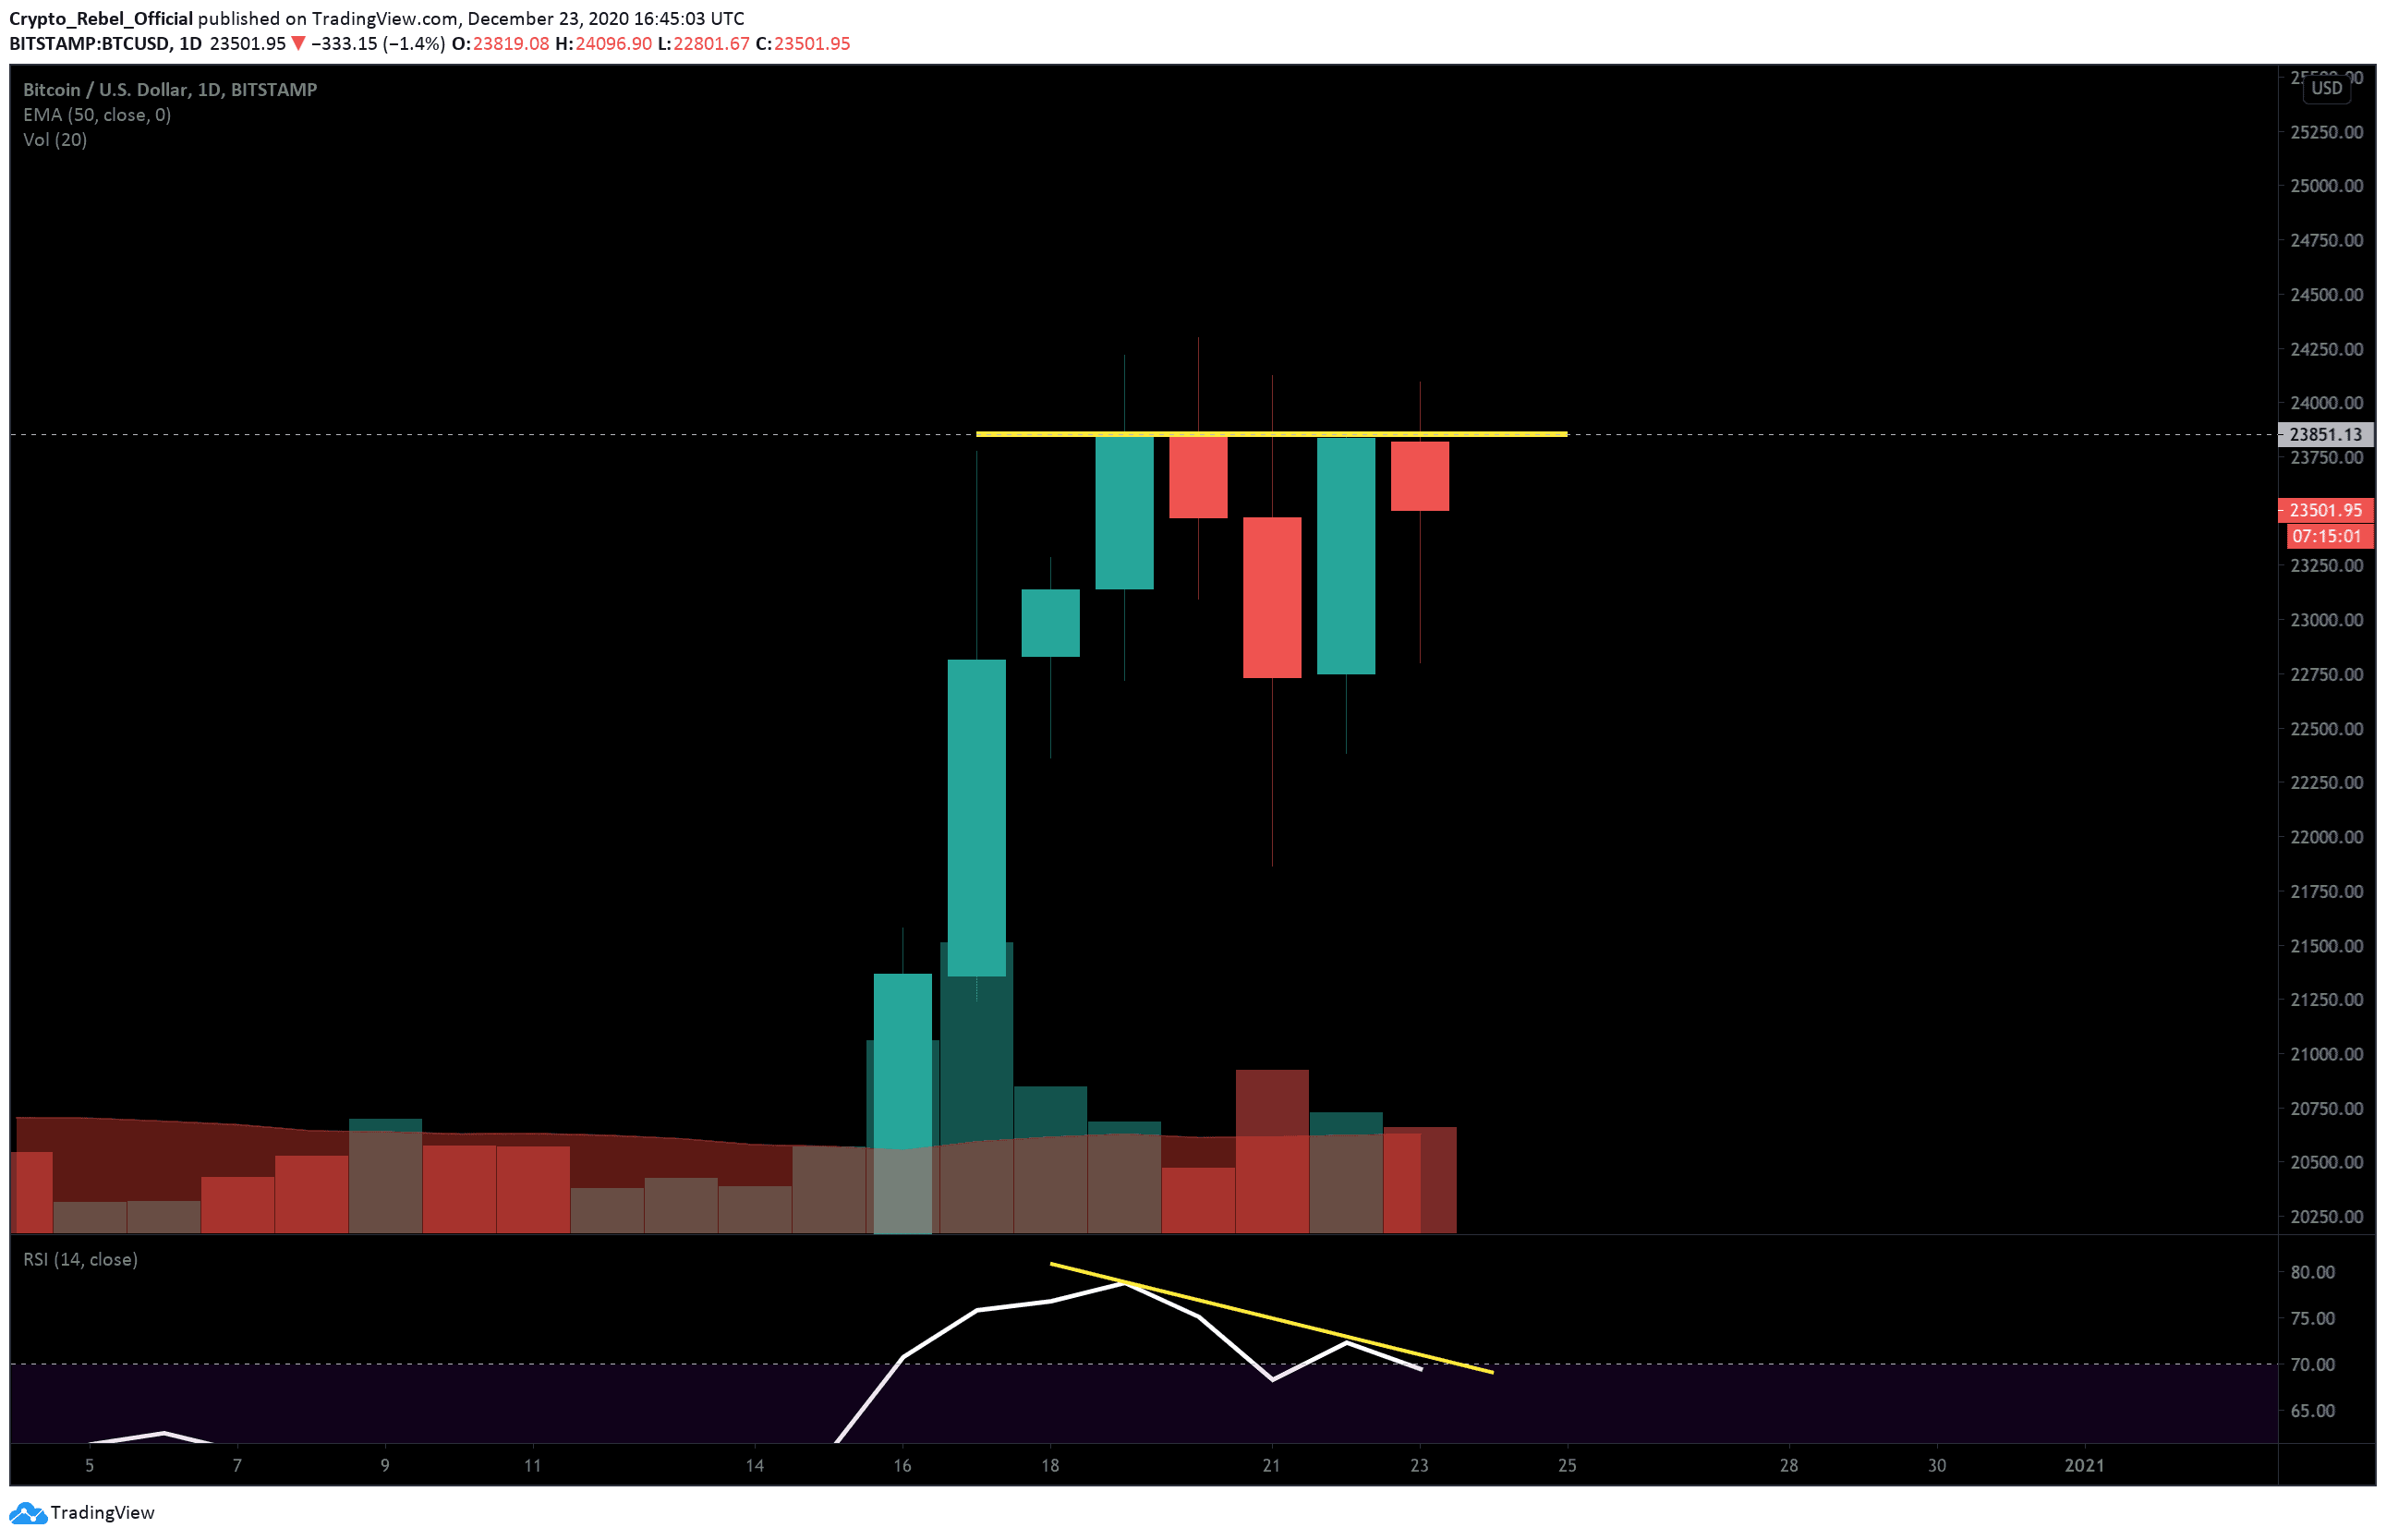
Bitcoin bulls need to make sure the daily price closes above $23,850 today, or else a double top will form on the BTC/USD chart (see below).
Double tops are bearish reversal setups that tend to result in strong downtrends. They form when an asset fails to breach the same resistance level twice in a short period of time. The second rejection signals to the market that bullish momentum has run out and that a shift in trend is about to occur.
There’s also an obvious RSI divergence (yellow line) over the same timeframe, which supports the current trend weakening idea. Not to mention, $19 billion has departed from the market since 00:01 (GMT) today, as the Bitcoin dominance is breaking records.
BTC Price Levels to Watch in the Short-term
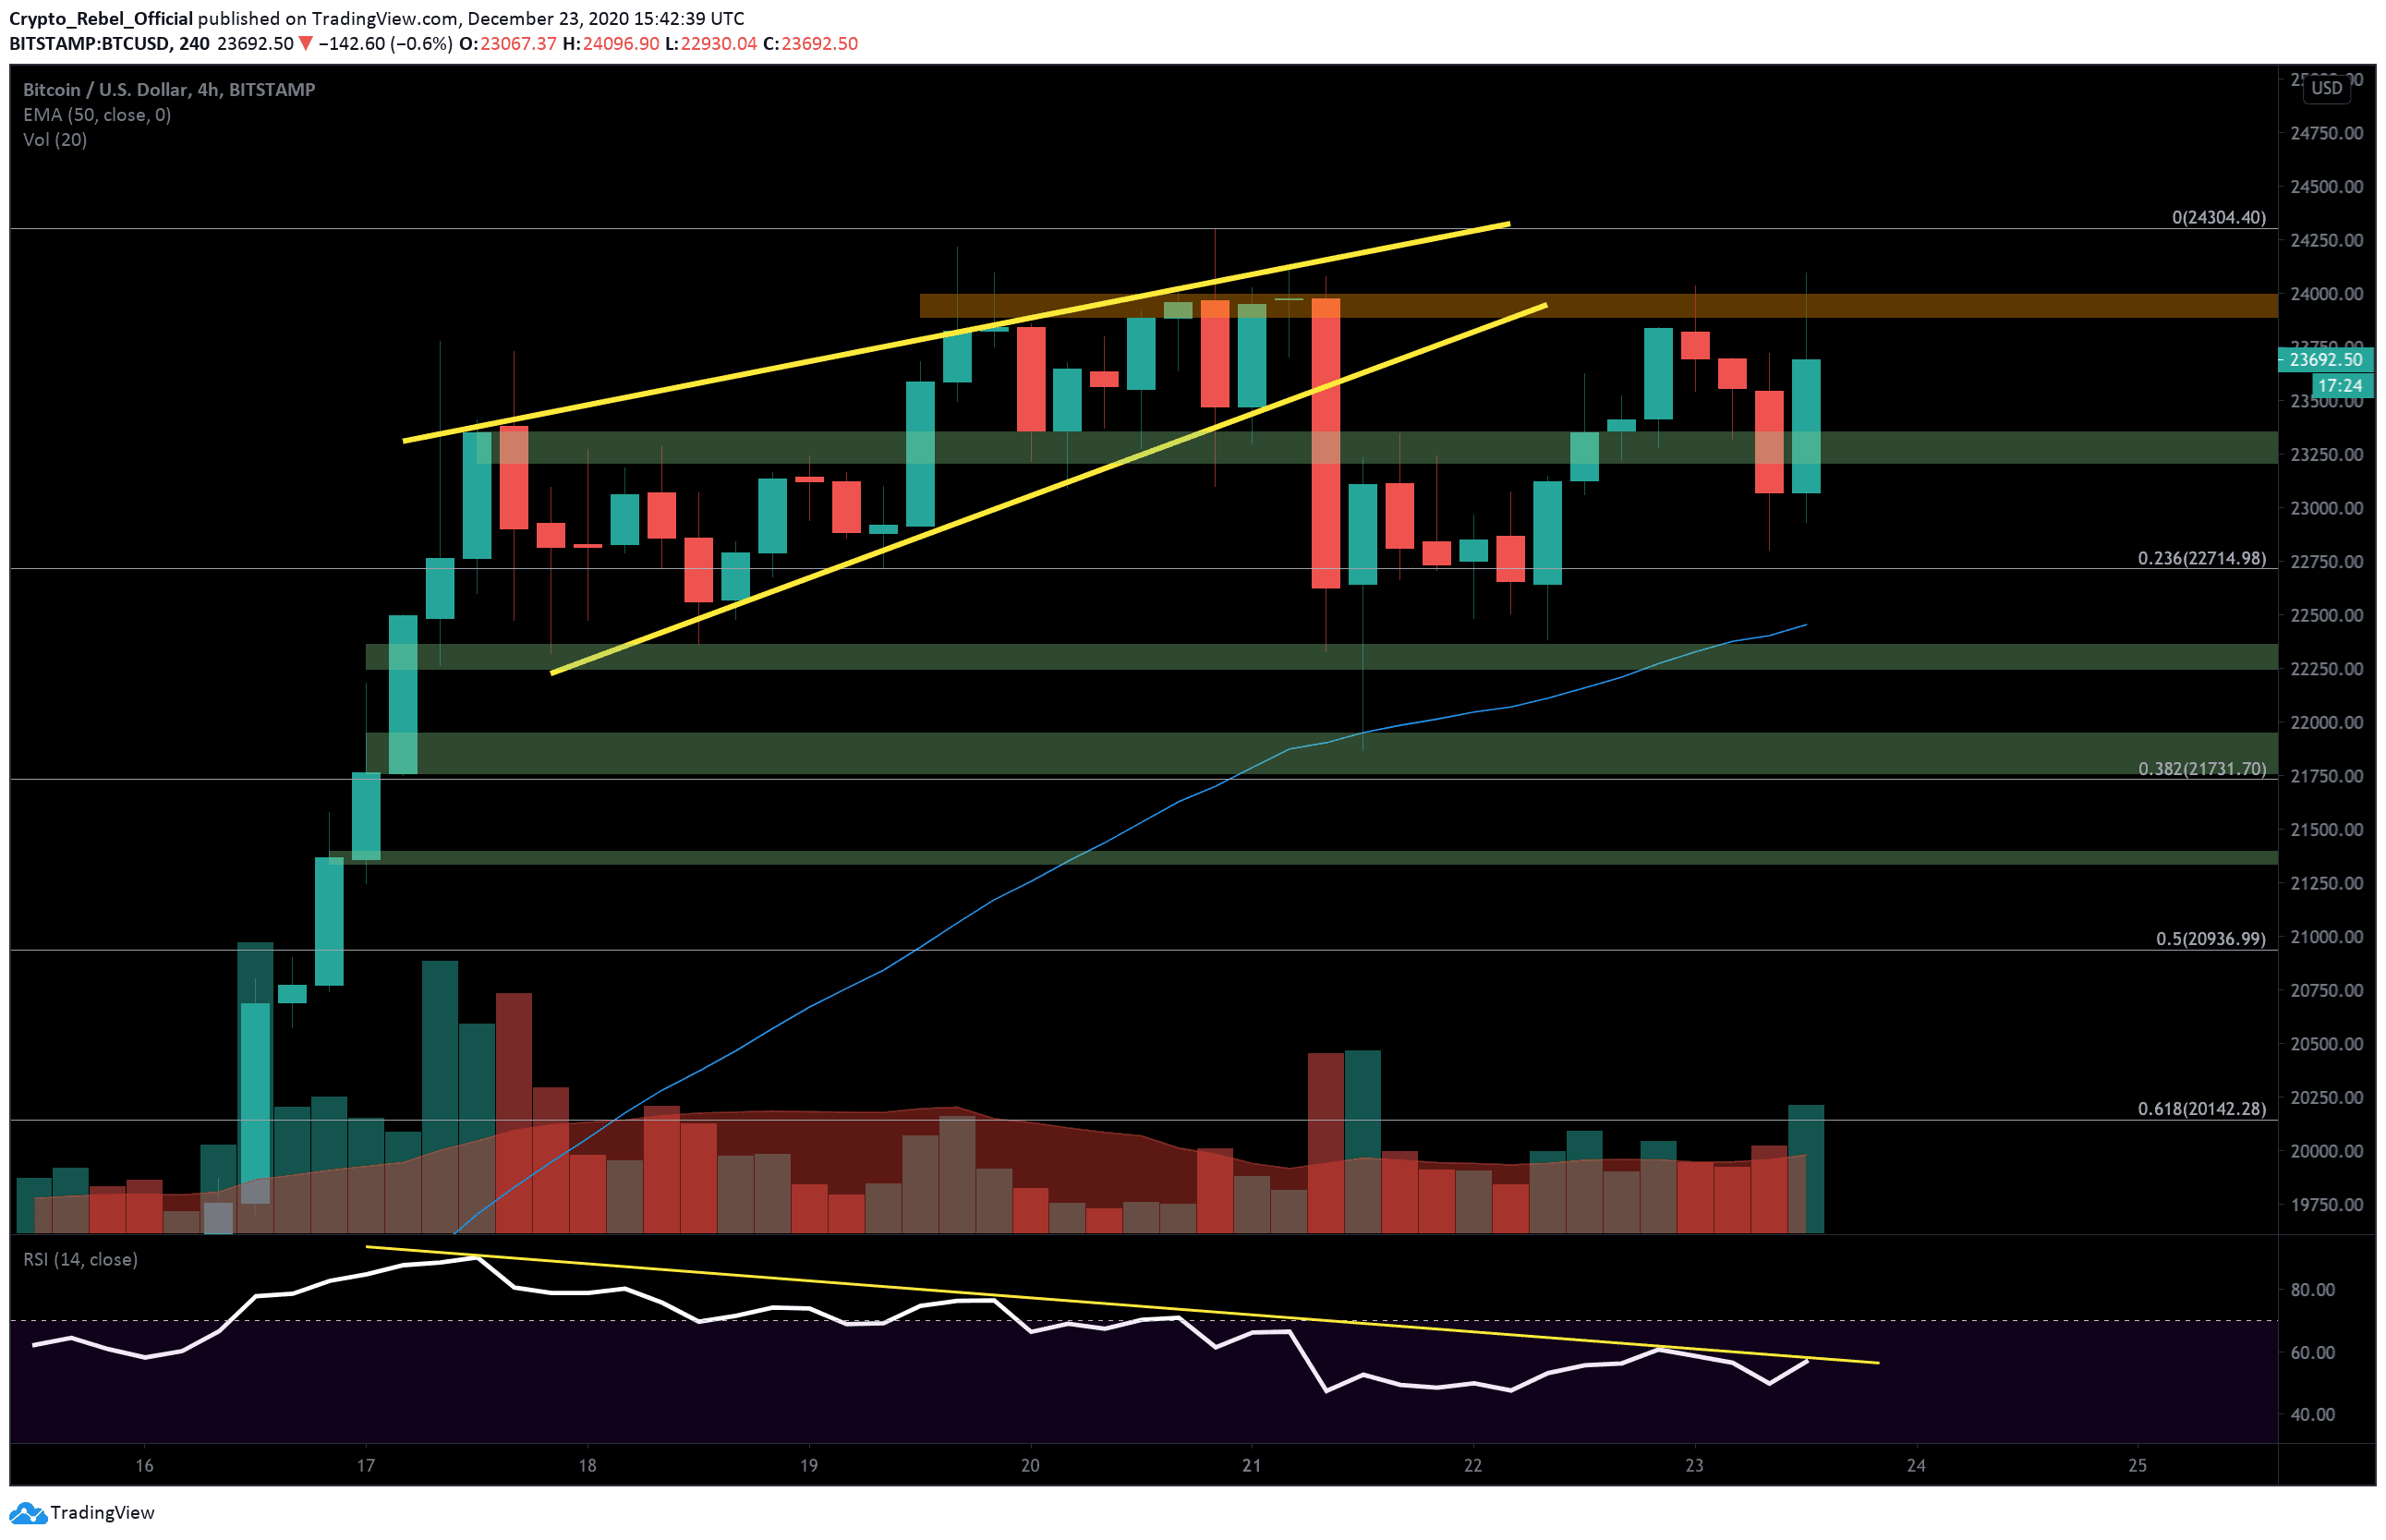
On the 4-hour BTC/USD chart, we can see the price has failed to close above $24,000 on two separate occasions within the last 24 hours (red bar). And, even though the leading cryptocurrency has printed a higher high today, it still hasn’t broken the sloping resistance on the RSI (yellow line on the 4-hour chart).
Once the indicator line breaks this area, it should be construed as an early indication that bullish momentum has returned behind Bitcoin and will likely foreshadow a bullish reversal. However, until then, we should anticipate the indicator line to continue down towards the oversold region – provided the double top forms.
In this bearish case, there are several key supports that will likely come into play during the double top breakout;
(1) $22,700 – 0.236 Fibonacci level.
(2) $22,500 – 50 EMA line (blue).
(3) $22,000 – Psychological level.
(4) $21,500 – Order block support (bottom green bar).
For bullish targets, the $24,000 level will continue to be the main resistance that buyers will need to break in order to confirm that a new bullish trend is underway. Further above the $24K lies the current ATH around $24,370, before the psychological level of $25,000.
Total market capital: $652 billion
Bitcoin market capital: $438 billion
Bitcoin dominance: 67.3%
*Data by Coingecko.
Bitstamp BTC/USD Daily Chart
Bitstamp BTC/USD 4-Hour Chart