Bitcoin price has erupted through the psychological ,000 level today. It is now breaking through the first high set way back in January 2018, after the primary cryptocurrency crashed from its all-time high level of nearly K. This is the first time Bitcoin has been above the ,200 mark in 1,066 days. Over the last 40 hours, billion has flooded back into the crypto markets – according to data by CoinGecko. It’s been speculated that one of the main catalysts for this explosive Bitcoin rally is that Chinese crypto miners have struggled to exchange their BTC block rewards for fiat currency due to the ongoing complications with OKEx and the CCP clamping down on other local brokers. Thus, the Bitcoin market has had significantly less selling pressure from miners,
Topics:
Ollie Leech considers the following as important: Bitcoin (BTC) Price, BTC Analysis, BTCEUR, BTCGBP, btcusd, btcusdt
This could be interesting, too:
Chayanika Deka writes XRP, SOL, and ADA Inclusion in US Crypto Reserve Pushes Traders on Edge
Chayanika Deka writes Why Arthur Hayes Is Bullish on Bitcoin Under Trump’s Economic Strategy
Mandy Williams writes Why the Bitcoin Market Is Stuck—and the Key Metric That Could Change It: CryptoQuant CEO
Wayne Jones writes Metaplanet Acquires 156 BTC, Bringing Total Holdings to 2,391
Bitcoin price has erupted through the psychological $17,000 level today. It is now breaking through the first high set way back in January 2018, after the primary cryptocurrency crashed from its all-time high level of nearly $20K. This is the first time Bitcoin has been above the $17,200 mark in 1,066 days.
Over the last 40 hours, $32 billion has flooded back into the crypto markets – according to data by CoinGecko. It’s been speculated that one of the main catalysts for this explosive Bitcoin rally is that Chinese crypto miners have struggled to exchange their BTC block rewards for fiat currency due to the ongoing complications with OKEx and the CCP clamping down on other local brokers.
Thus, the Bitcoin market has had significantly less selling pressure from miners, which has enabled the uptrend to continue unimpeded.
What Is Next: BTC Price Levels to Watch in the Short-term
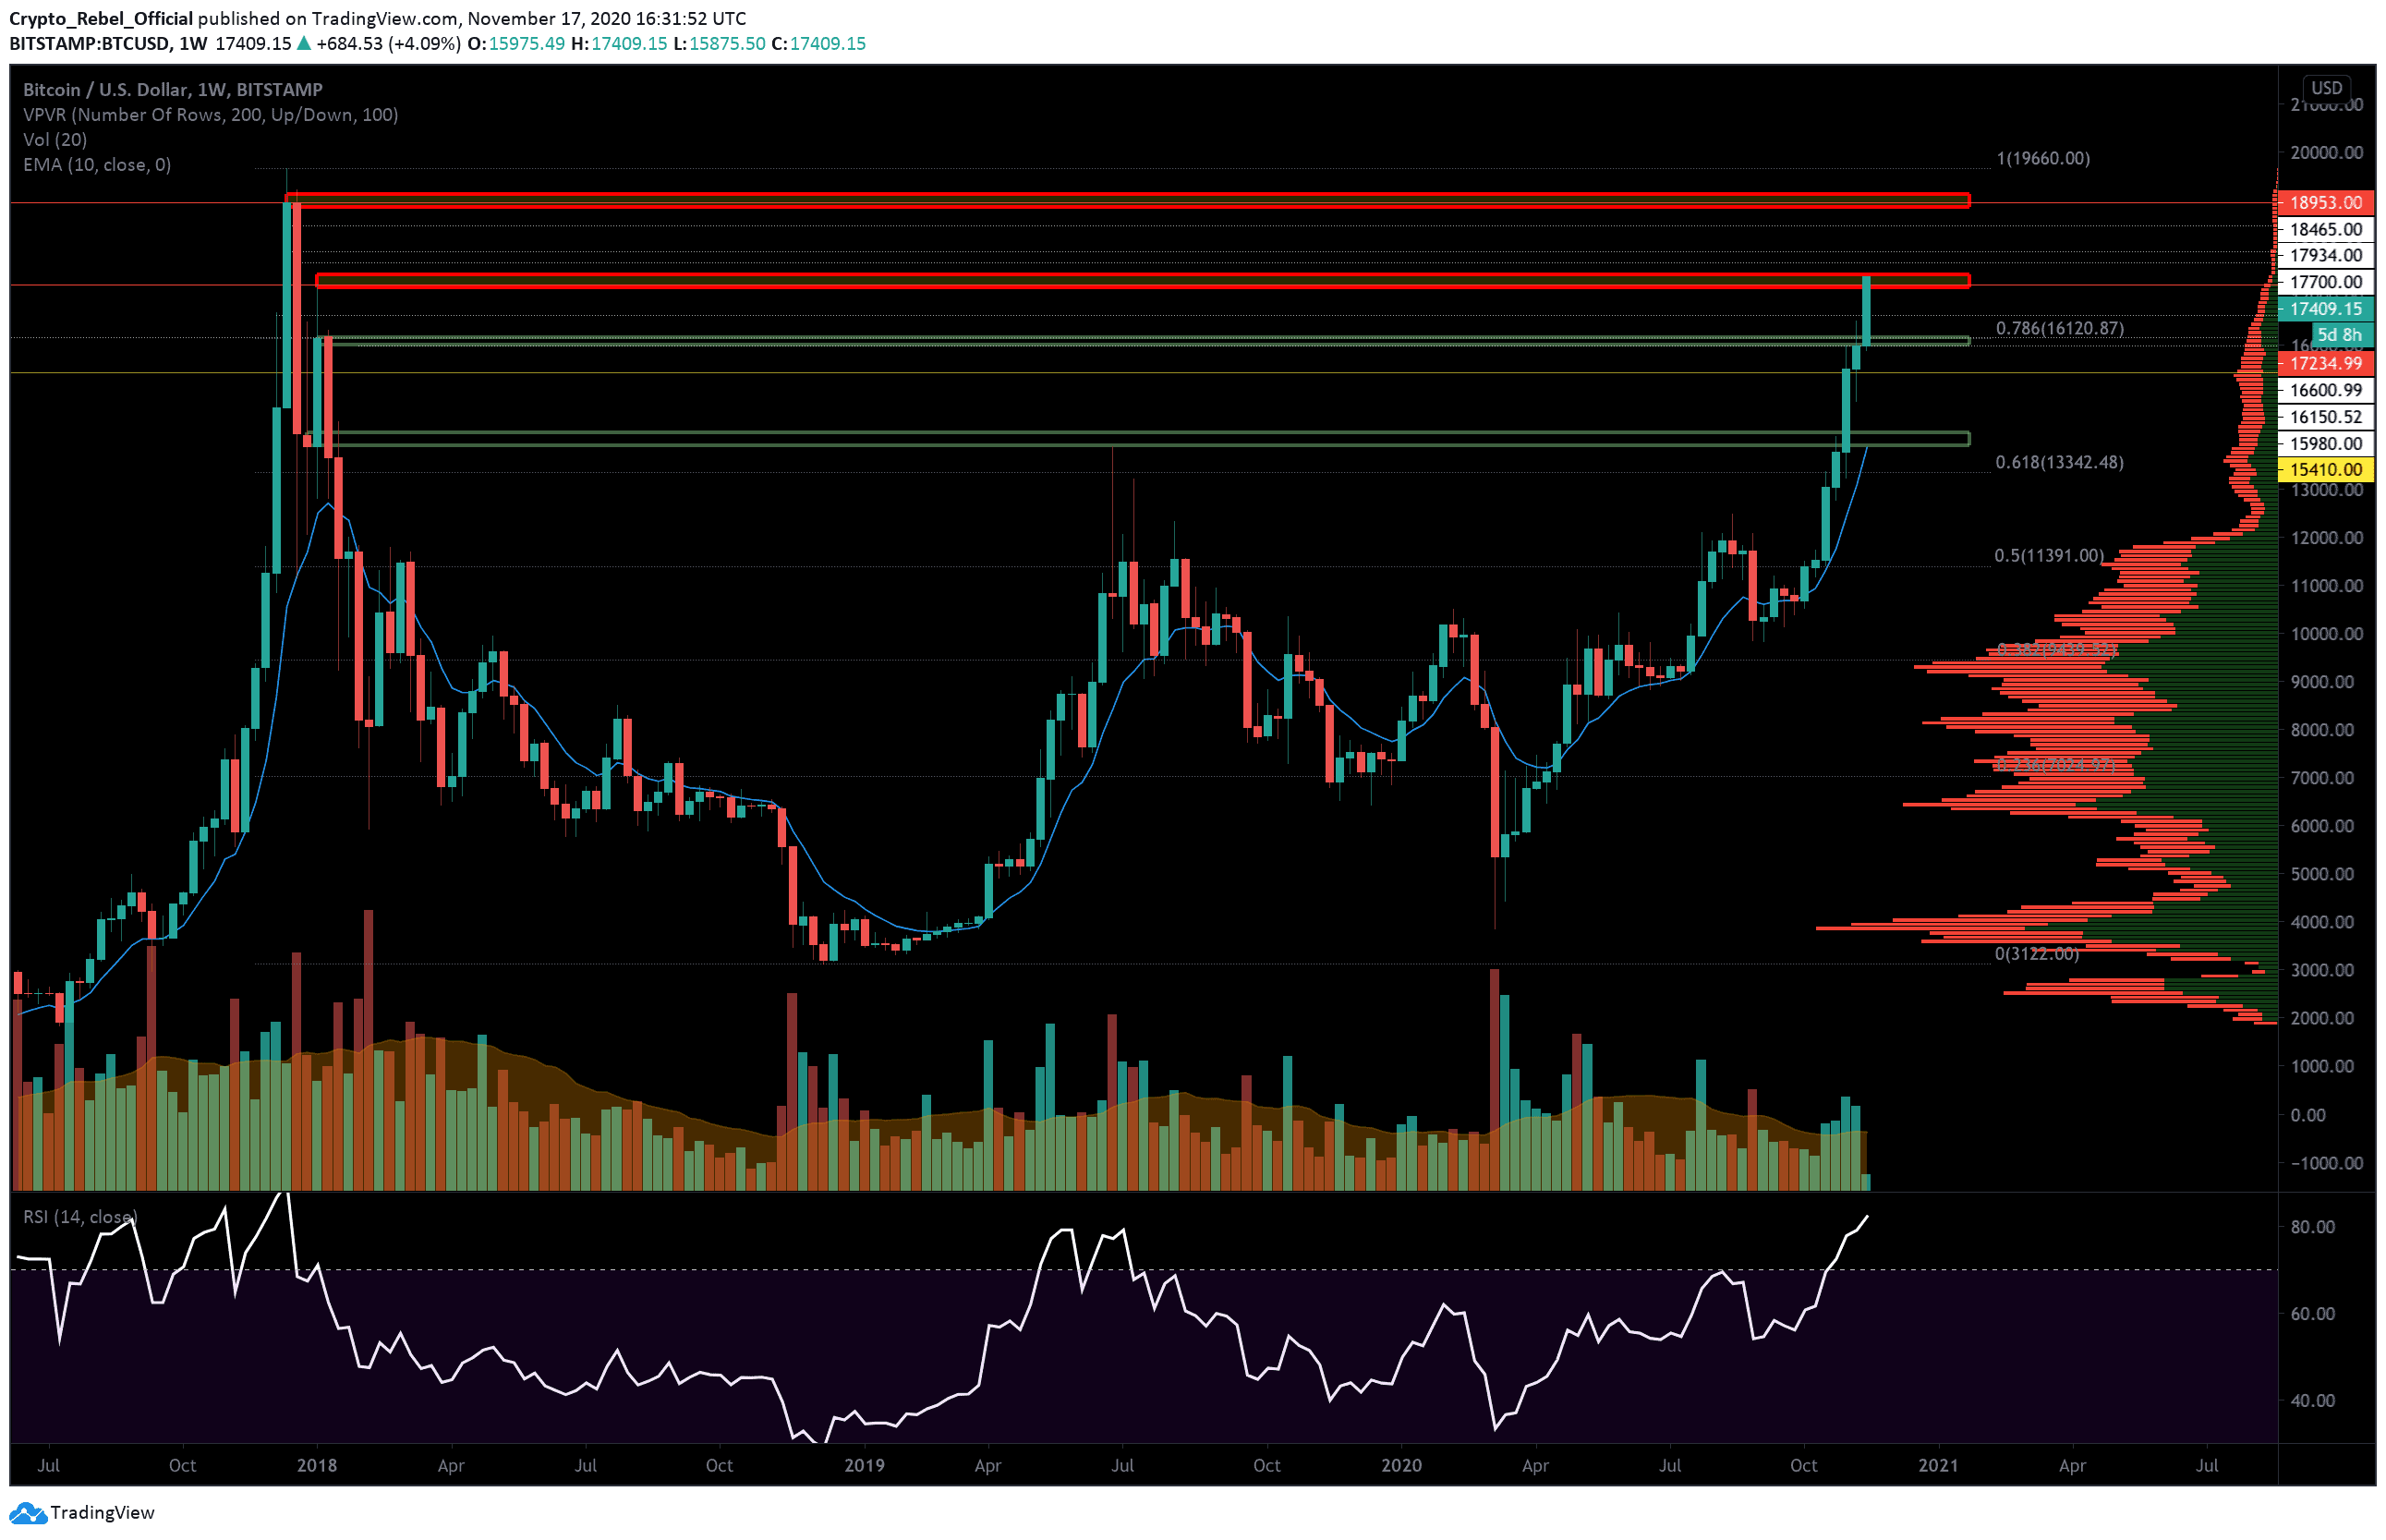
On the weekly BTC/USD, we can see that as of now, the bulls have already smashed through the January 6, 2018 high of $17,234 – this was the highest price BTC rebounded to directly after the first sell-off from the all-time high reached on December 17, 2017.
Currently, prices are meeting strong selling pressure around the $17,400 – $17,500, which was the daily high achieved back on December 15, 2017, during the parabolic climb towards $20K.
Looking above, we have other daily resistances set back in 2017 that could also create additional friction if the uptrend continues.
(1) $17,700
(2) $17,934
(3) $18,465
Beyond this, we have the highest weekly close ever on the Bitcoin chart that sits at $18,953, and the highest daily close at $19,187.
With any meteoric Bitcoin rally, there’s always the anticipation of a steep correction to follow. In the event that prices begin to correct sharply, the most likely short-term supports will be the $16,660, the 0.786 Fibonacci level at $16,150, and the $15,980 levels.
The main POC over the daily chart at $15,410 (yellow line) and the major support zone (lowest green bar) around $14,100 could also provide support if prices fall that far.
Total market capital: $496 billion
Bitcoin market capital: $320 billion
Bitcoin dominance: 64.5%
*Data by Coingecko.
Bitstamp BTC/USD Weekly Chart