Bitcoin price has managed to shake off fears of a correction today and is continuing to print new highs. During the start of the European trading session this morning between 08:00 -10:00 (UTC), BTC surged over 0 as a further billion poured into the global crypto market.After hitting the first resistance at ,100 – as mentioned in our last analysis – bulls are now pushing to overcome the next wall at ,300 (as of writing these lines). If they’re successful here, Bitcoin’s all-time high price is just 2% away!BTC Price Levels to Watch in the Short-termWith Bitcoin now clear of the psychological ,000 level, there are now just 3 main resistances standing in the way before prices return to the ,660, which is the ATH level on Bitstamp. Above this level, BTC is in price
Topics:
Ollie Leech considers the following as important: Bitcoin (BTC) Price, BTC Analysis, BTCEUR, BTCGBP, btcusd, btcusdt
This could be interesting, too:
Chayanika Deka writes XRP, SOL, and ADA Inclusion in US Crypto Reserve Pushes Traders on Edge
Chayanika Deka writes Why Arthur Hayes Is Bullish on Bitcoin Under Trump’s Economic Strategy
Mandy Williams writes Why the Bitcoin Market Is Stuck—and the Key Metric That Could Change It: CryptoQuant CEO
Wayne Jones writes Metaplanet Acquires 156 BTC, Bringing Total Holdings to 2,391
Bitcoin price has managed to shake off fears of a correction today and is continuing to print new highs. During the start of the European trading session this morning between 08:00 -10:00 (UTC), BTC surged over $700 as a further $20 billion poured into the global crypto market.
After hitting the first resistance at $19,100 – as mentioned in our last analysis – bulls are now pushing to overcome the next wall at $19,300 (as of writing these lines). If they’re successful here, Bitcoin’s all-time high price is just 2% away!
BTC Price Levels to Watch in the Short-term
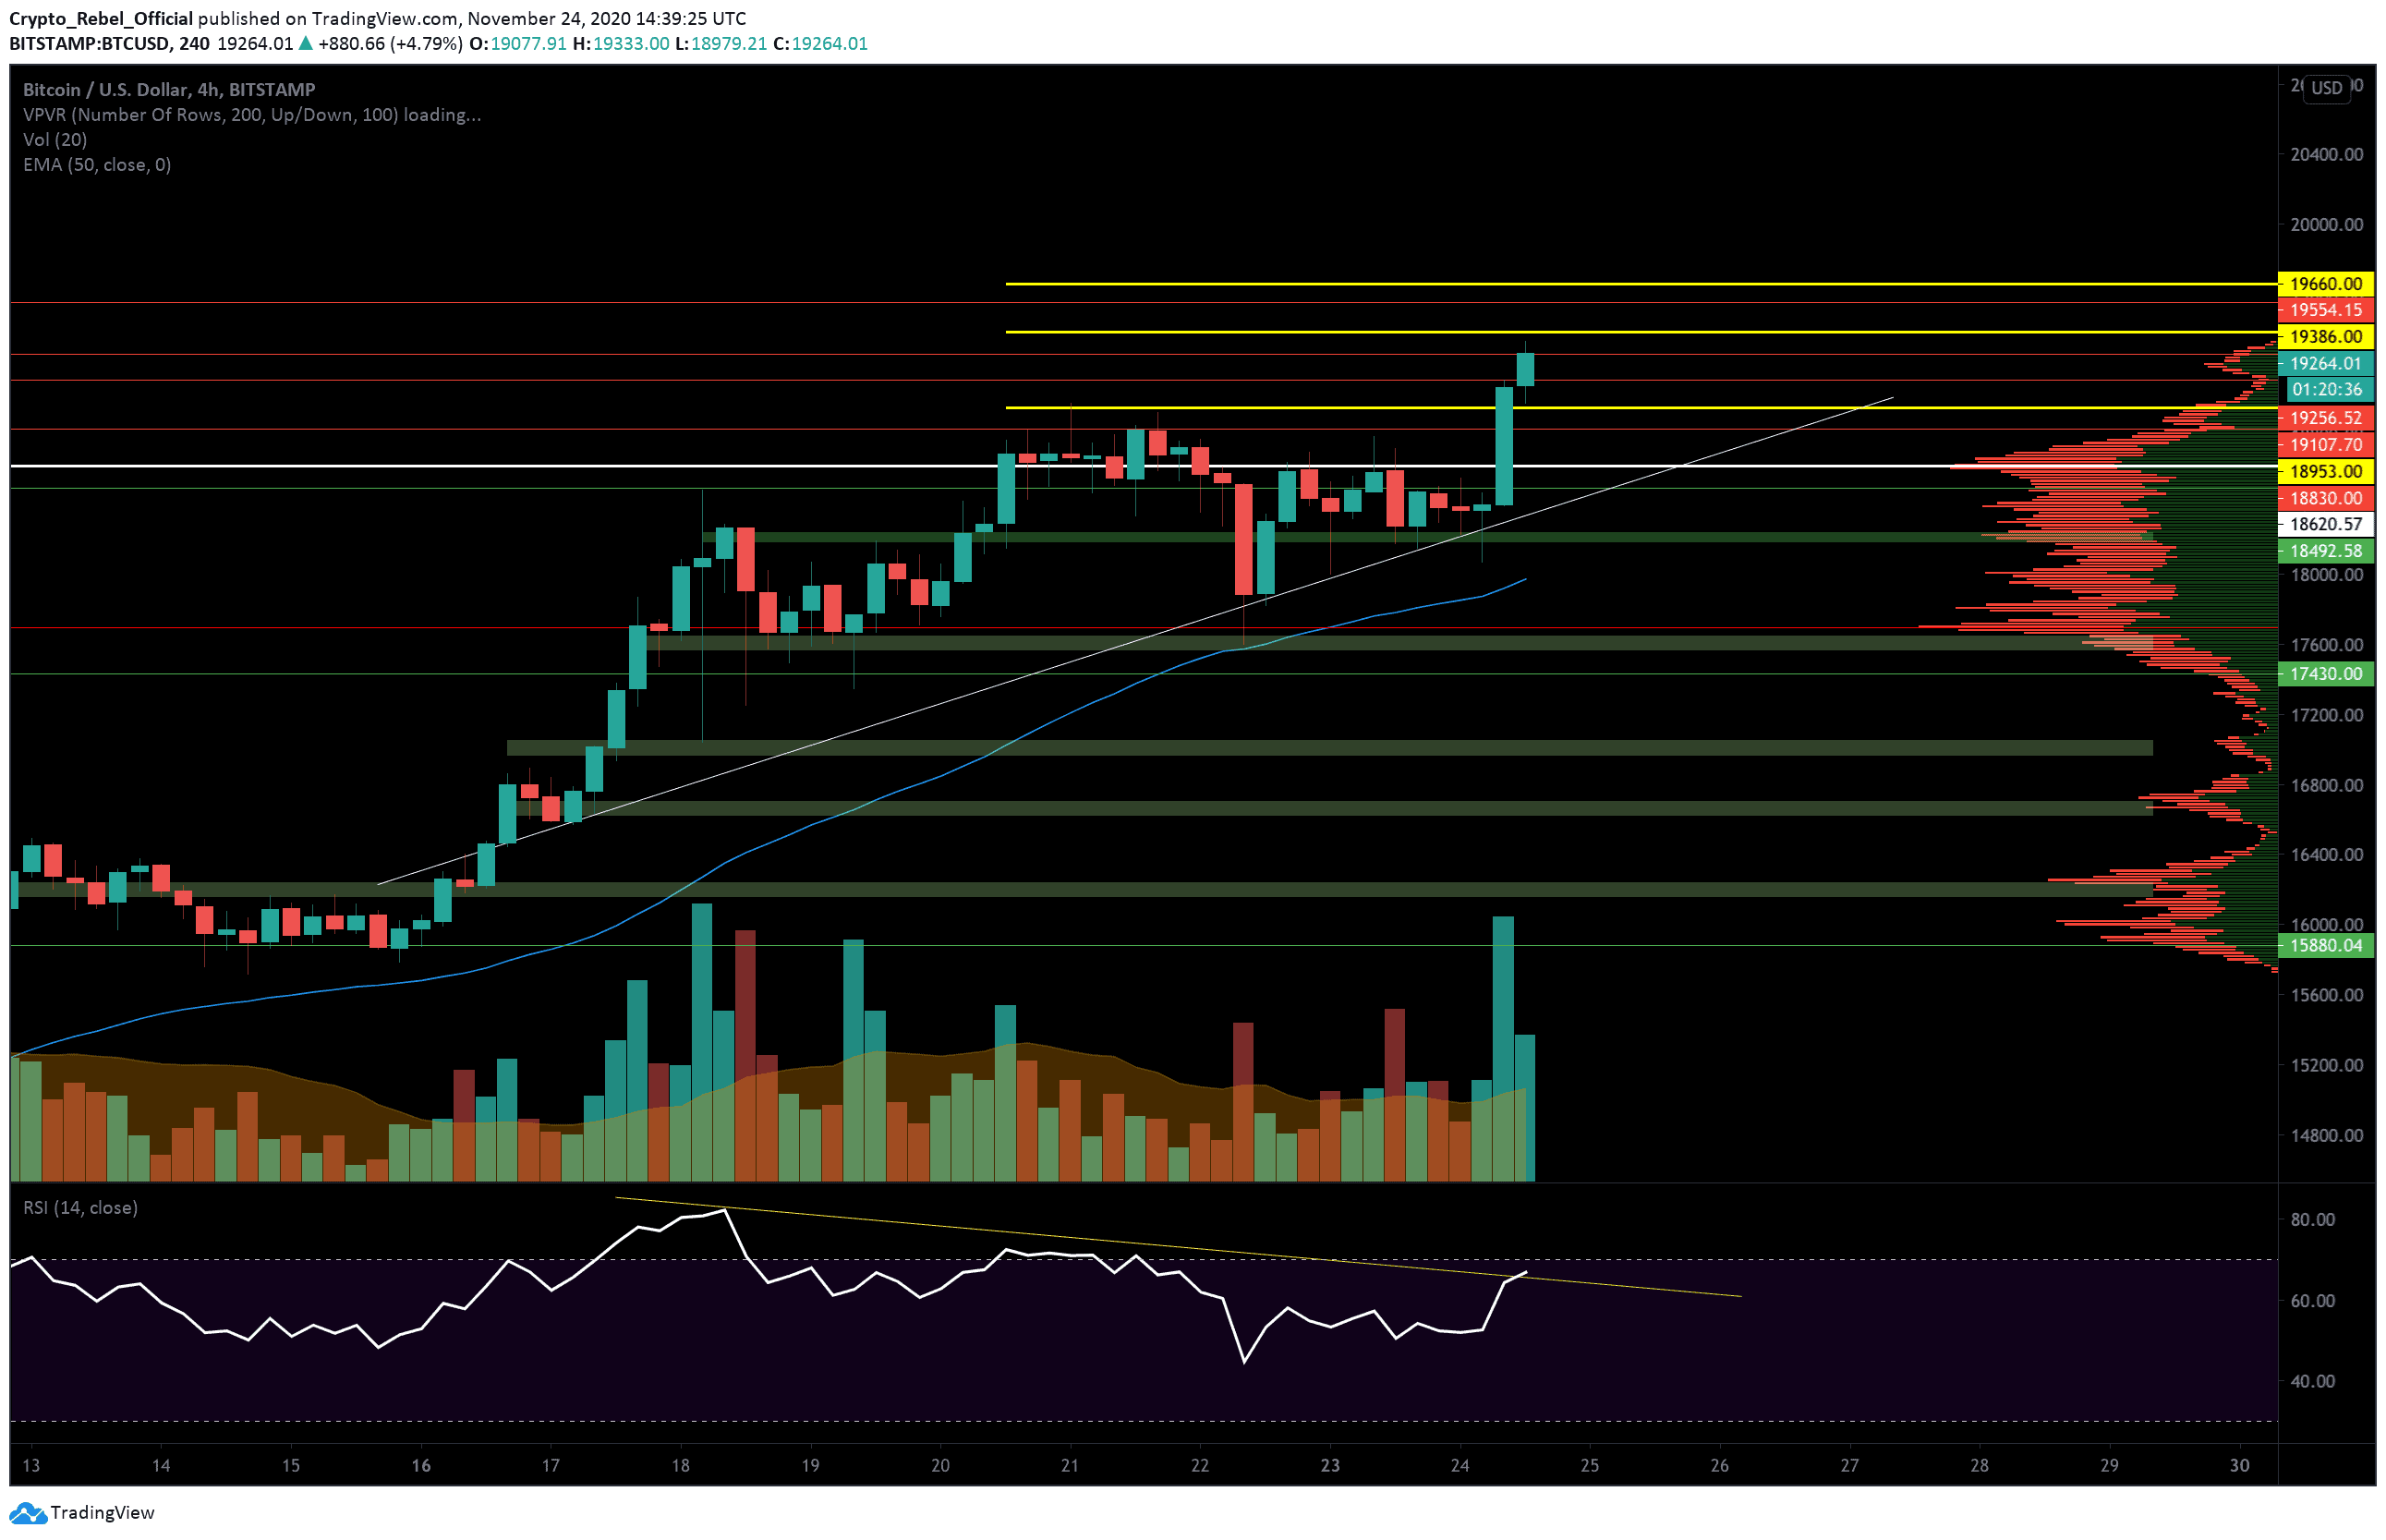
With Bitcoin now clear of the psychological $19,000 level, there are now just 3 main resistances standing in the way before prices return to the $19,660, which is the ATH level on Bitstamp. Above this level, BTC is in price discovery.
On the following 4-hour BTC/USD chart, we can see that bullish traders are experiencing some strong selling pressure at the aforementioned $19,300 level. This is a key 4-hour level from December 2017 and will require some effort to overcome. There is also a strong RSI divergence over this timeframe, which suggests bulls are growing tired.
Above this, we have the following price targets before the all-important level:
(1) $19,386 – Daily high from December 2017 (middle thick yellow line).
(2) $19,554 – Key 4-hour high from December 2017.
From there, we will likely see price wick above the $19,660 towards $19,800 as buyers test the water, followed by a correction to one of the above levels, which should flip into support. It’s unlikely that we’ll see buyers successfully close above the ATH on the first attempt.
If bullish traders lose steam at the current resistance and prices begin to tumble, we should expect these levels to provide support during the decline:
(1) $19,107 – Key 4-hour level from December 2017.
(2) $18,953 – Bitcoin’s highest weekly close. (first thick yellow line).
(3) $18,830 – key short-term support.
(4) $18,645 – key S/R level.
Total market capital: $584 billion
Bitcoin market capital: $356 billion
Bitcoin dominance: 60.9%
*Data by Coingecko.
Bitstamp BTC/USD 4-Hour Chart