Cryptocurrency analyst and creator of Bitcoin’s stock-to-flow model, PlanB, recently noted that an indicator that historically precedes bullish momentum according to his model has now flashed. Per his initial prediction, the asset is targeting a total market cap of trillion in the next few years.Bitcoin’s S2F ModelThe stock-to-flow model became an instant favorite among Bitcoin investors, mainly because of the optimistic forecast it makes. Namely, PlanB’s model suggests that the asset will surge to ,000 (or trillion BTC market capitalization) after the third halving, which took place in May this year.The analyst describes the “stock” part of his model as the size of existing stockpiles or reserves. The “flow” comes from the annual supply of BTC on the market, which decreases after
Topics:
Jordan Lyanchev considers the following as important: AA News, Bitcoin (BTC) Price, Bitcoin Long-Term Prediction, btcusd, btcusdt
This could be interesting, too:
Chayanika Deka writes Yuga Labs Secures Major Win as SEC Closes Investigation Without Charges
Andrew Throuvalas writes Bitcoin Soars Back To ,000 After BlackRock CEO Says “Buy The Dip”
Chayanika Deka writes XRP, SOL, and ADA Inclusion in US Crypto Reserve Pushes Traders on Edge
Chayanika Deka writes Why Arthur Hayes Is Bullish on Bitcoin Under Trump’s Economic Strategy
Cryptocurrency analyst and creator of Bitcoin’s stock-to-flow model, PlanB, recently noted that an indicator that historically precedes bullish momentum according to his model has now flashed. Per his initial prediction, the asset is targeting a total market cap of $1 trillion in the next few years.
Bitcoin’s S2F Model
The stock-to-flow model became an instant favorite among Bitcoin investors, mainly because of the optimistic forecast it makes. Namely, PlanB’s model suggests that the asset will surge to $55,000 (or $1 trillion BTC market capitalization) after the third halving, which took place in May this year.
The analyst describes the “stock” part of his model as the size of existing stockpiles or reserves. The “flow” comes from the annual supply of BTC on the market, which decreases after each halving. Bitcoin’s stock-to-flow ratio is to overtake that of gold around the year 2022, according to popular economist and author – Saifedean Ammous.
Bitcoin, being a scarce digital asset, is often compared with gold and silver. PlanB explained that both precious metals, which are different markets, are in line with BTC’s price prediction analysis. He added that this “gives extra confidence in the model.”
The New Red Dot
PlanB exemplifies the S2F model by specific dots in different colors moving in large cycles, marking each monthly close. Earlier today, he announced that the newest post-halving cycle has begun by the release of a red dot.
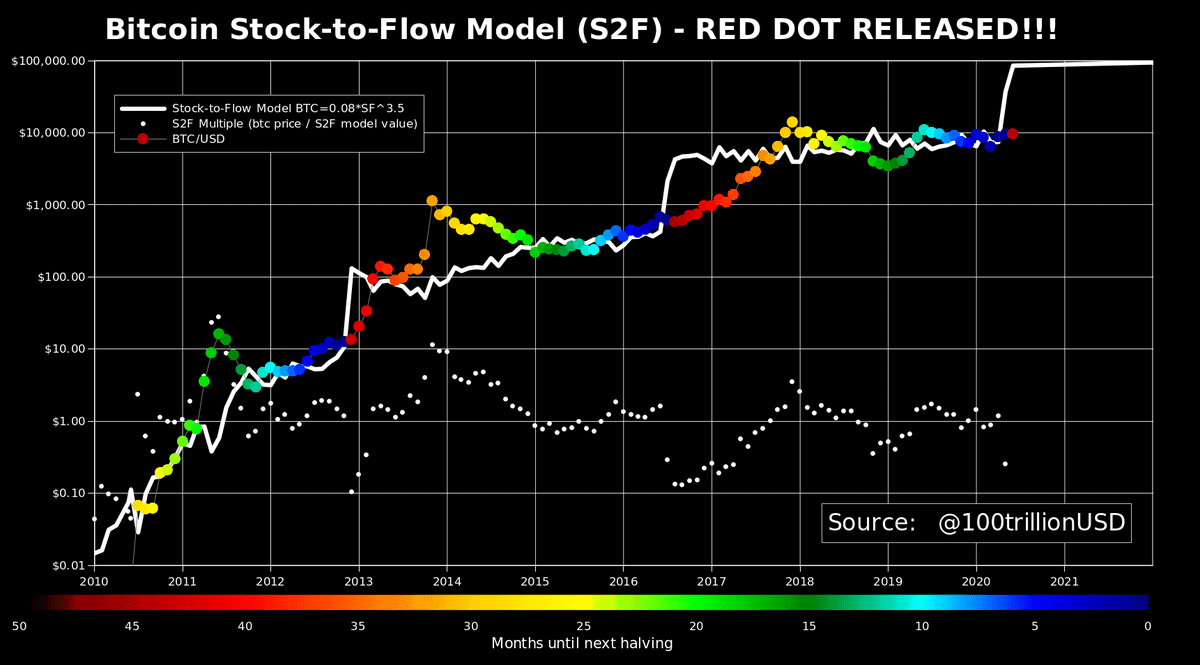
Historically, the red dot, which follows the end of the previous cycle colored in blue, has signaled the beginning of a new bull run. The first registered one occurred in late 2012 following the first Bitcoin halving.
The asset price was hovering just above $10. In the next few months, as the red dots illustrate, Bitcoin exceeded $100, before skyrocketing to over $1,000.
After the second red dot that followed the 2016 BTC halving, the results were more modest initially but quite positive in the long-term. The price of Bitcoin was below $1,000 and was steadily increasing with the next charted dots (monthly closings) before it peaked at nearly $20,000 in December 2017.
Fast-forward to today, the community welcomed the third red dot with open arms as it could signal another impressive price surge.