A popular cryptocurrency analyst pointed out that Bitcoin tested the 20-week moving average (MA) on its recent move down from ,000 to ,000. This could turn out to be a bullish sign for BTC, as identical price developments have pumped it higher during the last bull market in 2017.Bitcoin’s Recent Price DropsAfter dumping to below ,700 during the massive selloff in March, Bitcoin went on a roll. The primary cryptocurrency recovered its losses in a few months as the bulls took control. The asset kept surging in the summer and painted a year-to-date high of ,450 in mid-August.Although Bitcoin surpassed the ,000 mark on several occasions, it displayed issues maintaining above it. Following the latest pump on September 1st, BTC reversed for a violent price dive.After that, Bitcoin
Topics:
Jordan Lyanchev considers the following as important: AA News, Bitcoin (BTC) Price, BTCEUR, BTCGBP, btcusd, btcusdt
This could be interesting, too:
Chayanika Deka writes Yuga Labs Secures Major Win as SEC Closes Investigation Without Charges
Andrew Throuvalas writes Bitcoin Soars Back To ,000 After BlackRock CEO Says “Buy The Dip”
Chayanika Deka writes XRP, SOL, and ADA Inclusion in US Crypto Reserve Pushes Traders on Edge
Chayanika Deka writes Why Arthur Hayes Is Bullish on Bitcoin Under Trump’s Economic Strategy
A popular cryptocurrency analyst pointed out that Bitcoin tested the 20-week moving average (MA) on its recent move down from $12,000 to $10,000. This could turn out to be a bullish sign for BTC, as identical price developments have pumped it higher during the last bull market in 2017.
Bitcoin’s Recent Price Drops
After dumping to below $3,700 during the massive selloff in March, Bitcoin went on a roll. The primary cryptocurrency recovered its losses in a few months as the bulls took control. The asset kept surging in the summer and painted a year-to-date high of $12,450 in mid-August.
Although Bitcoin surpassed the $12,000 mark on several occasions, it displayed issues maintaining above it. Following the latest pump on September 1st, BTC reversed for a violent price dive.
After that, Bitcoin plummeted to $10,000 and even dipped below the psychological line a few times. As of writing these lines, BTC still struggles to remain in the five-digit territory.
History Suggests Possible Price Pump
The popular cryptocurrency YouTuber and analyst, Lark Davis (TheCryptoLark), noted that this price dive is somewhat expected in bull runs.
By looking at the macro scale, he compared Bitcoin’s recent behavior with the 2017 bull market when the asset was on its way to the all-time high of nearly $20,000.
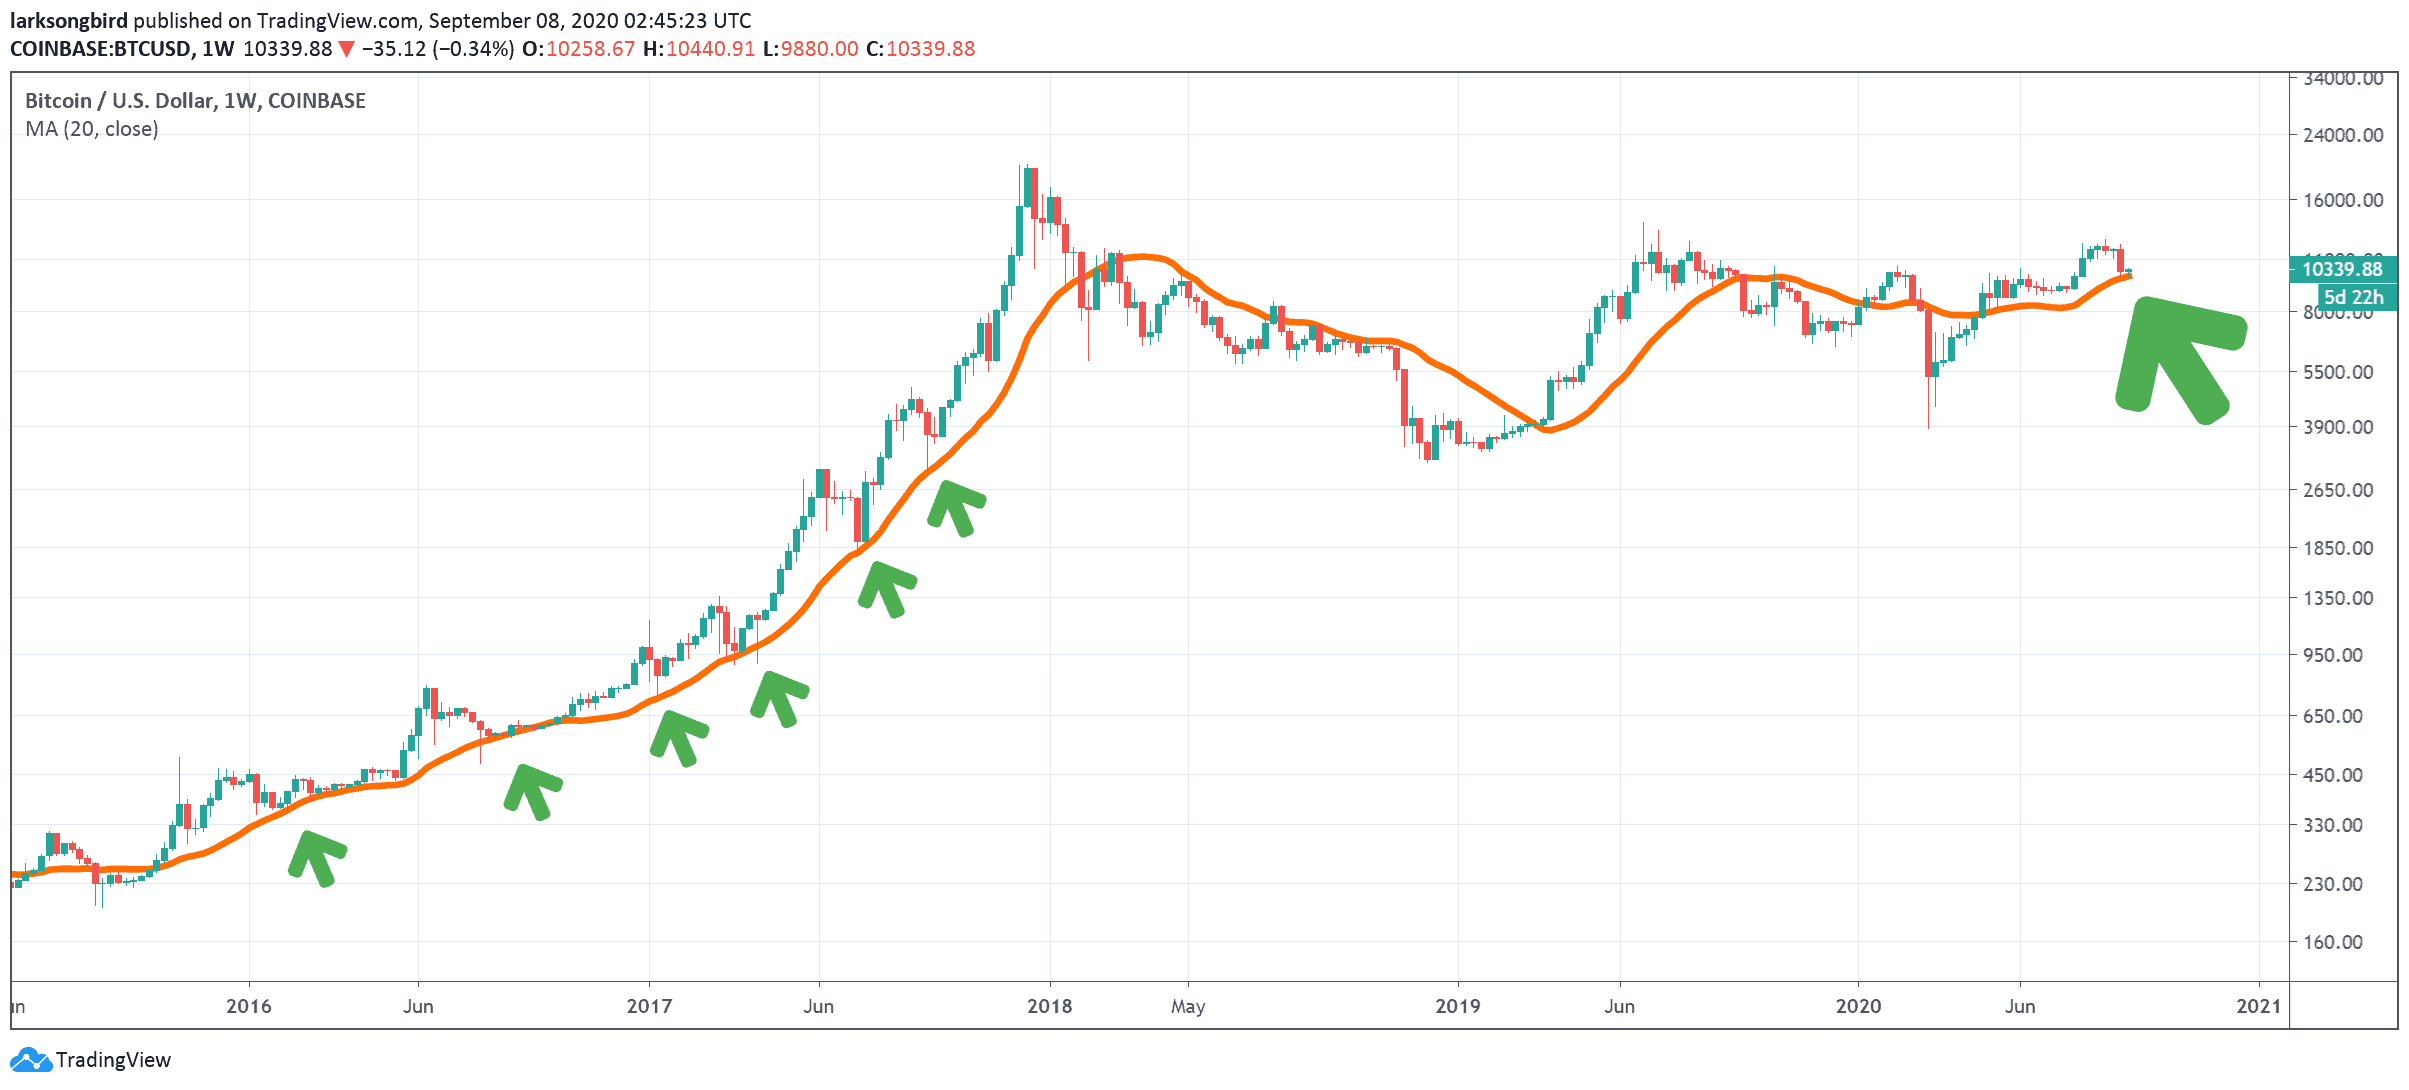
Davis brought out the 20-week moving average as his reasoning. As seen in the chart above, BTC tested the moving average on multiple occasions from the start of the last bull market in early 2017 to its peak in December 2017. Davis categorized those events as “the point of max gains.”
The analyst highlighted the importance of remaining above the 20-week MA. When BTC’s price fell below it after the bubble burst in early 2018, the asset went into a year-long bear market. This culminated in Bitcoin’s 2018 low of $3,100 – only a year after its peak.
Since then, the relationship between BTC and the 20-week MA saw its fair share of reversals before Bitcoin reclaimed the higher ground after the third halving in May.
By charting the massive red candle last week, BTC tested the 20-week MA once again. Consequently, if Bitcoin is to repeat its 2017 behavior, this dump could turn out to be another opportunity for maximum gains.